Part 8 in Evan Burger’s series on Iowa redistricting.
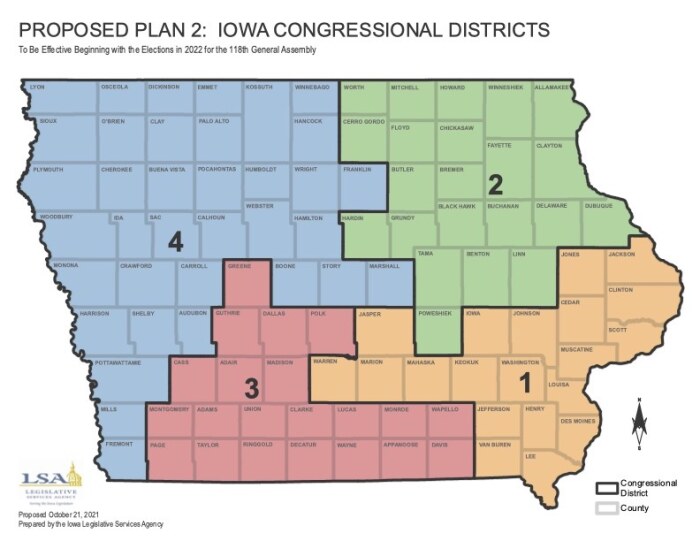
This morning, Iowa’s nonpartisan Legislative Services Agency (LSA) released their second redistricting proposal on October 21. Here’s a quick analysis of the Congressional map included in Plan 2; Laura Belin will write a companion piece examining the legislative maps later today.
The big takeaway is that this plan strongly resembles Iowa’s current map of U.S. House districts, especially when you look at the ten largest counties. Here is how Plan 2 groups those counties:
- IA-01: Johnson (Iowa City), Scott (Quad Cities)
- IA-02: Linn (Cedar Rapids), Black Hawk (Waterloo/Cedar Falls), Dubuque
- IA-03: Polk (Des Moines area), Dallas (Des Moines suburbs)
- IA-04: Story (Ames), Woodbury (Sioux City), Pottawattamie (Council Bluffs)
The current map groups those counties the same way, with the exception of Pottawattamie, which moves from the Polk district to the Story district.
Plan 2 by the numbers
As a reminder, the LSA has to balance three standards when drawing a proposed map: contiguity, population equality, and compactness. The Plan 2 map clearly meets the first standard: each Congressional district is made up of whole, contiguous counties. The map also does quite well on the population equality front:
- Lowest Population: District 3 (797,551)
- Highest Population: District 4 (797,645)
- Difference between lowest and highest population: 94
On this standard, the Plan 2 Congressional map is slightly better than the Plan 1, which had a difference of 99 people between the largest and smallest districts.
The Plan 2 map also scores better than Plan 1 on the “length-width” measure of compactness. On that standard, a shorter distance is better, and Plan 2 scores 31.03 miles compared to Plan 1’s 34.96 miles.
However, Plan 2 scores slightly worse than Plan 1 on the “perimeter length” measure of compactness. Again, shorter is better, but Plan 1 scored 2,772.02 miles, while Plan 2 scores 2,931.87.
Plan 2 is a great example of how the three standards are in tension with each other: improving Plan 1 on population equality and length-width compactness required the LSA to compromise on perimeter compactness. That said, Plan 2 is still a map that lives up to the LSA’s usual high standards — it’s very compact in addition to being more equal.
Plan 2’s partisanship
The LSA is not allowed to consider partisanship or past vote results when drafting their maps. But of course, everyone else is keenly interested in the partisanship of proposed maps.
As @maxtmcc pointed out on Twitter, 2020 presidential results for the newly proposed districts would have been:
- IA-01: Donald Trump 50 percent, Joe Biden 48 percent
- IA-02: Trump 51-47
- IA-03: Trump 49.2-48.8
- IA-04: Trump 62-36
That’s remarkably close to last year’s results in the current Congressional districts.
However, like the current map, this one would be quite swingy. When @maxtmcc looks instead at 2018 gubernatorial results, you see a different picture:
- IA-01: Fred Hubbell 51 percent, Kim Reynolds 47 percent
- IA-02: Hubbell 48.8-48.6
- IA-03: Hubbell 51-47
- IA-04: Reynolds 59-39
Most relevantly, when you look at a composite of the percent of the vote that the Democrat got in each county in the last three Congressional races, you get:
- IA-01: 52.59 percent
- IA-02: 48.72 percent
- IA-03: 49.25 percent
- IA-04: 40.83 percent
Unsurprisingly, since this map maintains the distribution of Iowa’s large counties, the partisan results also resemble the current map. That’s very similar to the current breakdown:
- Proposed IA-01 (current IA-02): 53.08 percent
- Proposed IA-02 (current IA-01): 48.96 percent
- IA-03: 48.26 percent
- IA-04: 41.16 percent
The Polk-based district would get a little bluer (as I predicted from the beginning), while the Linn, Johnson, and Story districts would get a little redder, but the overall breakdown of three competitive House seats and one safe Republican seat would stay the same.
What happens next
Unlike Plan 1, there is no public comment period for Plan 2 maps. They go straight to the legislature, which will convene next Thursday, October 28 (the earliest date state law allowed). As with everything in the Iowa legislature, Republicans will control what happens at that session. The Congressional side of Plan 2 seems on its face to be more acceptable to GOP leadership, mostly because it splits Johnson and Linn counties into two districts.
However, there are maps that are even more favorable to Republicans (for example, Dallas County could be placed in IA-04, leaving Polk with only deep-red rural counties). October 28 will be a crucial date — if legislative Republicans vote down Plan 2, we can be almost certain they will try for a true gerrymander via their ability to amend Plan 3.
If they accept Plan 2, Iowa’s gold standard redistricting process will remain intact for another cycle.
UPDATE/EDITOR’S NOTE from Laura Belin: Shane Vander Hart posted the voter registration numbers for the proposed districts. The new IA-01 would have 165,990 registered Democrats, 150,439 Republicans, and 147,261 no-party voters.
The new IA-02 would have 163,045 registered Democrats, 153,665 Republicans, and 153,173 no-party voters.
The new IA-03 would have 165,903 registered Democrats, 155,315 Republicans, and 132,390 no-party voters.
The new IA-04 would have 116,533 registered Democrats, 201,280 Republicans, and 128,280 no-party voters.
No Comments