Twelfth in a series interpreting the results of Iowa’s 2018 state and federal elections.
One of the hottest debates in Democratic activist circles relates to strategy for winning statewide and national elections. Does the party need to fix a base turnout problem by nominating contenders who will inspire passionate support among progressives? Or is the more urgent task appealing to voters who used to back Democrats, but lately have favored Republican candidates?
This post doesn’t claim to settle that argument, but searches for clues in the results and turnout rates from key Iowa counties where Fred Hubbell underperformed in his bid to unseat Governor Kim Reynolds.
TURNOUT IN IOWA’S 2018 ELECTION
Some 61.55% of registered Iowa voters cast ballots in this year’s general election, by far the highest statewide turnout for an Iowa midterm since 1994.
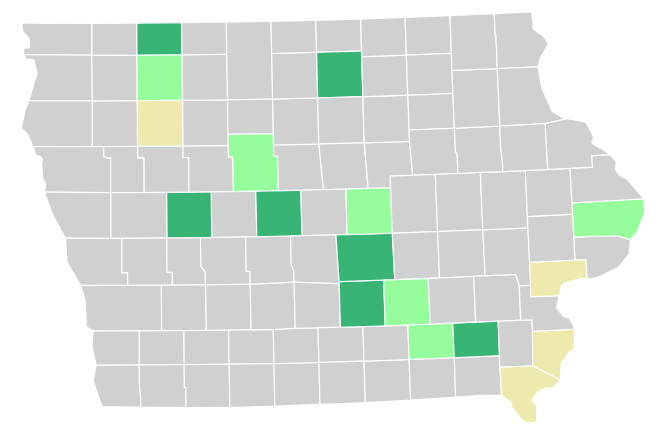
Turnout rates varied widely across Iowa. On this map, click on any county to bring up results for the Democratic and Republican candidates for governor and Congress there, as well as the percentage of registered voters who cast ballots. All figures come from the Iowa Secretary of State’s website and reflect numbers certified on December 3. As John Deeth pointed out, these turnout percentages compare voters to total registrants, which includes “inactive” voters (many of whom no longer live in the area). A higher share of active registered voters took part in this election.
County Name
| D | Canidate 1 | 61% | 30390 |
| R | Canidate 2 | 39% | 10390 |
turnout between 50% and 55%
turnout between 55% and 60%
turnout between 60% and 65%
turnout between 65% and 70%
turnout above 70%
Ringgold County surpassed 70 percent turnout, and fifteen other counties exceeded 65 percent, remarkable for a non-presidential year. There were clusters of high participation in central and northeast Iowa, partly because of competitive Congressional and state legislative races.
Fewer voters cast ballots in southeast Iowa. Six of the 24 counties in the second Congressional district (a federal election not targeted by either party) had turnout rates below 55 percent; two others (Clinton and Wapello) barely exceeded 55 percent.
Turnout was also underwhelming in most of the counties containing medium-sized cities, some of which used to be solid Democratic vote-producers.
TURNOUT IN IOWA’S MID-SIZED COUNTIES
Last month, Bleeding Heartland took a close look at past and present voting for governor in seventeen “micropolitan” counties containing urban populations between 10,000 and 30,000. Click on any county here to show support for Hubbell and Reynolds and turnout in those areas.
County Name
| D | Canidate 1 | 61% | 30390 |
| R | Canidate 2 | 39% | 10390 |
Hubbell above 50%
Hubbell won with less than 50%
Reynolds won with less than 50%
Reynolds between 50% and 60%
Reynolds above 60%
The same data are on this map, but I changed the color scheme to reflect turnout levels rather than votes for Hubbell and Reynolds.
County Name
| D | Canidate 1 | 61% | 30390 |
| R | Canidate 2 | 39% | 10390 |
turnout between 50% and 55%
turnout between 55% and 60%
turnout between 60% and 65%
Most of the mid-sized counties had turnout below the statewide average. Seven of them were among the dozen with the lowest participation rates: the four colored yellow, plus Wapello (55.1 percent turnout), Clinton (55.2 percent), and Webster (55.4 percent). I expected higher turnout in Clinton and Wapello, where both parties were targeting open state Senate seats. In addition, Hubbell’s running mate Rita Hart is from Clinton County. A targeted Iowa House race was in Webster County (Fort Dodge area).
The same data in a table, with counties in descending order from most to least votes cast in the governor’s race:
| How Fred Hubbell and Kim Reynolds performed in micropolitan counties | |||||
| County | Hubbell votes | Hubbell vote share | Reynolds votes | Reynolds vote share | Turnout |
|---|---|---|---|---|---|
| Cerro Gordo | 8,971 | 47.3% | 9,614 | 50.7% | 60.9% |
| Clinton | 9,047 | 49.6% | 8,847 | 48.6% | 55.2% |
| Jasper | 7,234 | 45.4% | 8,377 | 52.6% | 61.7% |
| Des Moines | 8,038 | 53.1% | 6,827 | 45.1% | 53.8% |
| Marion | 5,249 | 34.9% | 9,479 | 63.0% | 62.9% |
| Muscatine | 7,081 | 47.3% | 7,535 | 50.3% | 52.8% |
| Marshall | 7,095 | 48.4% | 7,243 | 49.4% | 59.5% |
| Webster | 6,132 | 43.3% | 7,727 | 54.6% | 55.4% |
| Lee | 6,387 | 50.5% | 5,973 | 47.3% | 54.0% |
| Boone | 5,793 | 47.6% | 6,097 | 50.1% | 62.6% |
| Wapello | 5,480 | 45.5% | 6,313 | 52.4% | 55.1% |
| Carroll | 3,162 | 35.3% | 5,628 | 62.9% | 63.4% |
| Dickinson | 3,134 | 35.4% | 5,564 | 62.9% | 64.9% |
| Mahaska | 2,409 | 28.0% | 6,007 | 69.9% | 58.2% |
| Jefferson | 3,750 | 53.0% | 3,146 | 44.5% | 63.3% |
| Clay | 2,417 | 35.0% | 4,364 | 63.1% | 59.0% |
| Buena Vista | 2,649 | 40.4% | 3,771 | 57.4% | 53.4% |
These numbers don’t prove that poor base turnout is the primary reason Hubbell underperformed in mid-sized counties. Nor is the problem limited to the 2018 nominee for governor. Last month’s post mentioned other reasons voters in largely working-class towns have drifted away from Democratic candidates, ending the careers of some state legislators with deep roots in their communities.
Still, Iowa Democrats should be aware that residents of micropolitan counties were noticeably less engaged in this high-turnout election.
Also worth noting, and something to think about for future voter mobilization efforts: a number of the micropolitan counties contain large Latino populations. They include Buena Vista (Storm Lake area), Marshall (Marshalltown), Wapello (Ottumwa), and Muscatine.
TURNOUT IN IOWA’S LARGEST COUNTIES
More than half of all Iowans who voted in the latest general election live in a relatively large metro area. Because of long-term demographic trends, the percentage of statewide ballots cast coming from the ten largest counties will continue to grow with each election cycle.
As Bleeding Heartland discussed in more detail here, Hubbell did very well in some of these counties. But in other large counties (Dubuque, Scott, Black Hawk, Woodbury, and Pottawattamie), he underperformed compared to Tom Vilsack and Chet Culver, the only Democrats to hold the governor’s office during the past half-century.
Click on any county here to bring up votes for Hubbell and Reynolds and turnout in the largest counties.
County Name
| D | Canidate 1 | 61% | 30390 |
| R | Canidate 2 | 39% | 10390 |
Hubbell above 70%
Hubbell between 50% and 60%
Hubbell won with less than 50%
Reynolds between 50% and 60%
The same numbers are embedded in this interactive map, with colors corresponding to each county’s turnout level.
County Name
| D | Canidate 1 | 61% | 30390 |
| R | Canidate 2 | 39% | 10390 |
turnout between 50% and 55%
turnout between 55% and 60%
turnout between 60% and 65%
turnout between 65% and 70%
Turnout was very high in Dallas, Polk, and Linn counties, but well below the statewide average in Pottawattamie, Scott, and Woodbury. That’s been an ongoing problem in those areas, not a new development in 2018, so it’s hard to say whether lower participation was correlated with the unimpressive numbers for Hubbell.
Turnout was close to the statewide average in Johnson and Story; those counties contain Iowa’s largest college towns and produced record margins for a Democratic candidate for governor this year. UPDATE: John Deeth, who works in the Johnson County elections office, noted that by using total registrants rather than active voters, the Secretary of State’s office makes “turnout look lower especially here in Johnson which has highest inactive numbers in state. Inactive does NOT mean ‘weak voter’ it’s a preliminary step to cancellation.”
Participation in Black Hawk County was slightly below the statewide average. Hubbell probably could have done better there.
On the other hand, turnout was slightly above the statewide level in Dubuque, where Democrats used to lead by thousands of votes, but Hubbell barely edged out Reynolds. Democrats will hope that result was related to Hubbell’s close ties to Planned Parenthood and not a sign of a long-term realignment in a county that was solidly blue for decades. Congressional candidate Abby Finkenauer (a Dubuque native) did much better than Hubbell here. Though she is also pro-choice, she did not make reproductive rights a central issue in her campaign.
Here are the same figures, for readers who prefer a table.
| How Fred Hubbell and Kim Reynolds performed in largest counties | |||||
| County | Hubbell votes | Hubbell vote share | Reynolds votes | Reynolds vote share | Turnout |
|---|---|---|---|---|---|
| Polk | 120,257 | 58.1% | 82,473 | 39.9% | 66.8% |
| Linn | 56,767 | 55.6% | 42,449 | 41.6% | 66.3% |
| Scott | 35,147 | 50.7% | 32,750 | 47.3% | 54.6% |
| Johnson | 48,758 | 71.6% | 18,119 | 26.6% | 61.3% |
| Black Hawk | 29,259 | 54.9% | 22,786 | 42.8% | 60.0% |
| Story | 25,155 | 58.7% | 16,535 | 38.6% | 62.0% |
| Dubuque | 21,108 | 49.4% | 20,532 | 48.0% | 61.8% |
| Dallas | 19,804 | 47.4% | 21,189 | 50.8% | 68.1% |
| Woodbury | 15,024 | 42.4% | 19,630 | 55.4% | 56.8% |
| Pottawattamie | 14,234 | 41.7% | 19,036 | 55.8% | 52.5% |
Any relevant comments or ideas for boosting future turnout are welcome in this thread.
2 Comments
Pet Peeve
They’re using TOTAL voter registration which includes inactive status voters. That tends to understate turnout and hurts Johnson County the most because we have the most most mobile population and the most Inactive voters. Using Active status only is a more accurate picture.
To repeat myself: Inactive does NOT mean what a staffer would call “a weak voting D.” It means “post office reports they have moved away” and is a preliminary step to cancellation.
jdeeth Tue 4 Dec 1:56 PM
good point
I have added that clarification above.
My understanding is that the Iowa Secretary of State’s office has always reported turnout this way (e.g. for this page showing turnout in past elections), but please correct me if that is wrong.
desmoinesdem Tue 4 Dec 3:07 PM