Three weeks ago today, Iowa Department of Public Health Deputy Director Sarah Reisetter told reporters our state’s novel coronavirus (COVID-19) infections might hit “a first peak in the next two to three weeks.” But Iowa has racked up more confirmed cases and deaths attributed to COVID-19 during the past three days than in any previous three-day period. Outbreaks continue to be identified in long-term care facilities and meatpacking plants, where one infected person can pass the virus to many others.
Governor Kim Reynolds imposed stricter limits on socializing outside the household in fourteen northeast Iowa counties on April 16. The next day, she ordered all schools in the state to remain closed through the remainder of this academic year. But even as the governor encouraged Iowans to stay home if they can, she asserted on April 17 that “there are a lot of really positive signs” and suggested officials may be ready to start opening things up in parts of the state soon.
Meanwhile, the country’s most widely-cited model for COVID-19 now projects that use of hospital resources and coronavirus deaths in Iowa will peak on May 7 and 8, respectively. The Institute for Health Metrics and Evaluation (IHME) at the University of Washington also indicates that “relaxing social distancing may be possible” in Iowa after June 29. By comparison, the same model projects that the states of Washington and California already passed their peak for deaths and hospital resource use and may be able to scale down mandatory social distancing on May 18.
Why hasn’t Iowa turned the corner?
A FLAWED MATRIX INSTEAD OF MODELING
Reisetter said at the governor’s March 29 news conference that the department’s “best estimate right now” was that Iowa “might see a peak, a first peak in the next two to three weeks.” How officials arrived at that prediction remains a mystery. We now know the team advising Reynolds on COVID-19 mitigation, led by State Medical Director Dr. Caitlin Pedati, had no internal modeling of how fast the virus was spreading or how various policies would affect the growth rate of cases.
Rather, the IDPH designed a twelve-point scale for Iowa’s regions based on four metrics: the share of the population over age 65, percent of identified cases requiring hospitalization, rate of COVID-19 infections per 100,000 population over the past 14 days, and outbreaks in long-term care facilities.
The Iowa City Press-Citizen was first to obtain and report on a document (enclosed below) with details on the matrix. Dr. Eli Perencevich, an infectious disease specialist and epidemiologist at the University of Iowa, told reporter Zachary Oren Smith, “Instead of tracking the spread of disease to protect older Iowans, we are using them like a canary in the coal mine to determine how bad things are.”
Peter Fisher dismantled the “arbitrary scoring method divorced from all the epidemiological analysis and modeling that is taking place elsewhere” in an analysis for the Iowa Fiscal Partnership. He concluded,
The scoring is entirely backward looking. This is particularly dangerous for a disease that spreads so easily and where, as we all know by now, cases and hospitalizations grow exponentially, everywhere that the disease has been found. Historical data in Iowa and in places where the diseases arrived much earlier is useful, but only because it allows one to determine the rate at which the disease is spreading. The fewer the number of days it is taking for the number of cases to double, the sooner we will arrive at a peak, the sharper that peak will be, and the more likely it is that we face a potential health disaster. Again, projected cases and hospitalizations is the goal, not history.
State Auditor Rob Sand also questioned the matrix in an April 4 letter to Reynolds. Excerpts:
(8) The “percent of population over 65” is a static number that won’t vary during the pandemic. Several highly impacted counties (Johnson, Polk, Linn) have very few older people and would not trigger this threshold even at 15%. Why did you include a component that could never be triggered in many of Iowa’s bigger, already more highly impacted urban areas?
(9) The “percent of identified cases requiring hospitalization” is not linked to the size of the outbreak, nor the availability of PPE [personal protective equipment]. For example, if there are only 10 COVID19 cases in a population and 2 are admitted to a hospital, it would add 3 points. However, if there are 100,000 and 11,000 were in the hospital (far beyond the beds actually available), it would only add 1 point. Why were these thresholds selected as percentiles, rather than a ratio of total hospitalized vs total available hospital beds, ICU beds or ventilators?
(10) The “rate of COVID19 infections per 100,000 population in past 14 days” component does not consider 1) if the counts are increasing or decreasing or (2) how quickly they are changing. Why did you select a metric that would not measure to how fast the diseases is spreading, which could indicate whether the state is on an exponential growth curve, and if so, where?
(11) Long-term care facilities are isolated from the community by design. Thus, they would not be as affected by community transmission and social distancing interventions in the community, nor would they as strongly affect economic and community essential operations. For example, large factories for food production are critically important for the functioning of our society and would also be more affected by widespread COVID19 disease. So why were only “long-term care outbreaks” considered when many other critical areas of mass gathering would give a better sense of community transmission? Why did you not include essential factory workers diagnosed with COVID19 in the tool? Or healthcare workers?
Reynolds didn’t reply, prompting Sand to make his letter public on April 7. He added in a news release that the “Governor’s failure to answer basic questions about pandemic assessment tool speaks volumes.”
The IDPH has not revealed which experts designed the twelve-point scale, nor have they cited any scientific studies validating that approach. And although Reynolds claimed on April 6 that “a couple of states have contacted Dr. Pedati to start using some of the metrics,” officials declined on subsequent days to name any states purportedly interested in adapting Iowa’s matrix for their own decision-making.
RECOMMENDATIONS STILL “BASED ON WHAT IS ACTUALLY HAPPENING”
The IDPH belatedly arranged for some modeling. Under a contract signed on April 7, the University of Iowa’s College of Public Health will provide “a model that will predict the number, severity and timing of future infections, hospitalizations and deaths,” Ryan Foley reported for the Associated Press. “The model would be modified to predict how shifts in strategies, such as a stay-at-home order, might change public health outcomes.”
But Reisetter confirmed on April 13 that the department hadn’t yet sent any data to university researchers.
One of the things about modeling is you need a sufficient baseline of data so that any model can be actually informative of what you’re trying to do. […]
We really wanted to make sure that we had enough data so that any modeling that they did would actually be meaningful based on what’s actually happening here in Iowa. And all along, the mitigation measures that we have been recommending to Governor Reynolds, that has been based on what is actually happening here in Iowa. So do we have community spread, do we have evidence of that. […]
Because as the governor has explained, models, you know, can be helpful, but they’re not going to necessarily be prescriptive in terms of the actions that we take. And so, we’re going to continue to look at modeling, look at forecasting, because we understand that we’re going to be in this for a while. But every recommendation that we’ve been making has been based on what is actually happening here in Iowa.
The idea that you shouldn’t model spread of an infectious disease until you have a large dataset of known cases will be news to everyone in the public health field.
By that logic, IHME should have let things play out for another month or two before creating its COVID-19 projections. A model will provide a range of possible outcomes, which may change as new data is entered. (The IHME’s projection for total Iowa deaths through early August has fluctuated between around 400 and nearly 1,500 and now stands at 624.)
Reisetter had illustrated one problem with the “what is actually happening” approach earlier during the April 13 media availability. Although COVID-19 cases in Louisa County were rapidly increasing due to an outbreak at the Tyson pork processing plant in Columbus Junction, the IDPH had just lowered the matrix score for region 5 (covering much of southeast Iowa) from “9” to “8.” When a reporter asked why, Reisetter explained,
What’s happened in region 5 is as we’ve continued to see case counts increase, the severity of the illness has also decreased. So the rate of hospitalization has gone down. So for that particular metric, that has gone from a “3” to a “2,” related to the hospitalization rate.
The IDPH further lowered region 5 to a “7” on April 14. Perencevich commented on Twitter that the “matrix makes no public health sense […] When you get new cases, they aren’t sick. They get sick later – in 1-2 weeks. So paradoxically, when cases are exploding and you should socially distance this matrix will say don’t socially distance.”
In an email to Bleeding Heartland the same day, Perencevich added,
I think my biggest concern today is the very high per-capita infection rates in Louisa County and several other rural counties (e.g. Tama Co.) – we should probably be pushing selective county sheltering at home policies to help these counties without hospitals or enough ICU beds get through the next few weeks. I worry that the region approach is not selective enough for the needs of a geographically (urban, suburban, rural) diverse state.
On April 16, region 5 popped back up to a “9,” along with region 1, including the Des Moines area. But region 6, containing Linn County (which has the highest number of confirmed cases and deaths) hit “10.”
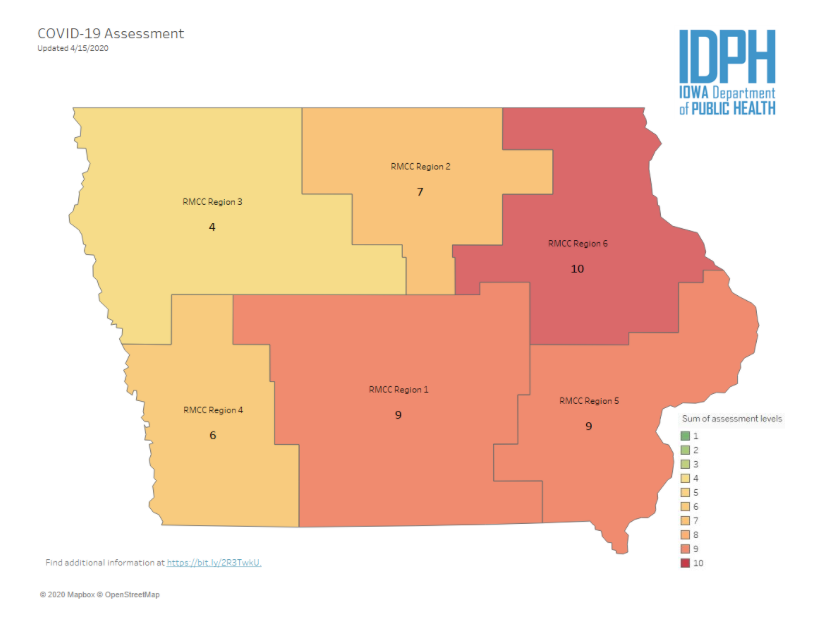
The original IDPH document explaining the matrix had indicated that a score of 10 would trigger a shelter-in-place order. Without using that terminology, Reynolds issued a new proclamation that was nearly the same–but only for the fourteen counties in region 6. That order limits “social, community, recreational, leisure, and sporting gatherings” to “people who live together in the same household,” aside from weddings, funerals, and spiritual or religious gatherings that cannot exceed ten participants. The proclamation will be in effect from April 17 through April 30.
Thousands of people regularly commute between Linn County (in region 6) and Johnson County (region 5). Under the “data-driven” regional approach Reynolds often touts, they are subject to different limits on their movements.
Adding to the confusion, the new restrictions don’t apply in southeast or central Iowa counties where new COVID-19 cases continue to increase rapidly. Perencevich commented on April 18, “The IDPH decision matrix doesn’t follow epidemiological standards, so not surprising that policy isn’t working. Now they’re doubling down in the face of evidence that things are worsening.” The growth in Johnson County cases suggests to him that further action is warranted.
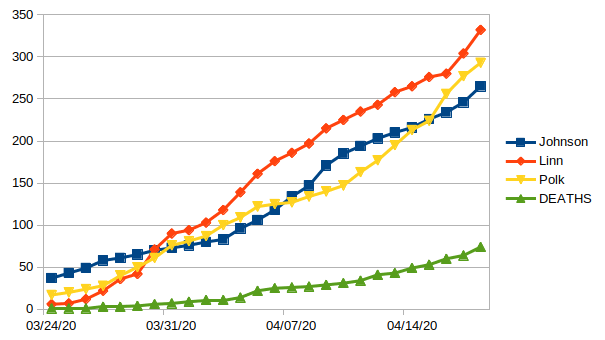
Moreover, Polk County (containing Des Moines and most of its suburbs) has overtaken Johnson County in terms of total cases, and its case counts are rising more steeply. Ditchwalk plotted the daily numbers to show the trend lines.
An unknown number of employees at the Tyson pork plant in Perry (Dallas County) have COVID-19 as well. Yet for some reason, the IDPH has lowered the score for the central Iowa region from 9 on April 16 to 8 at this writing. The most recent regional map available on the state’s official COVID-19 dashboard:
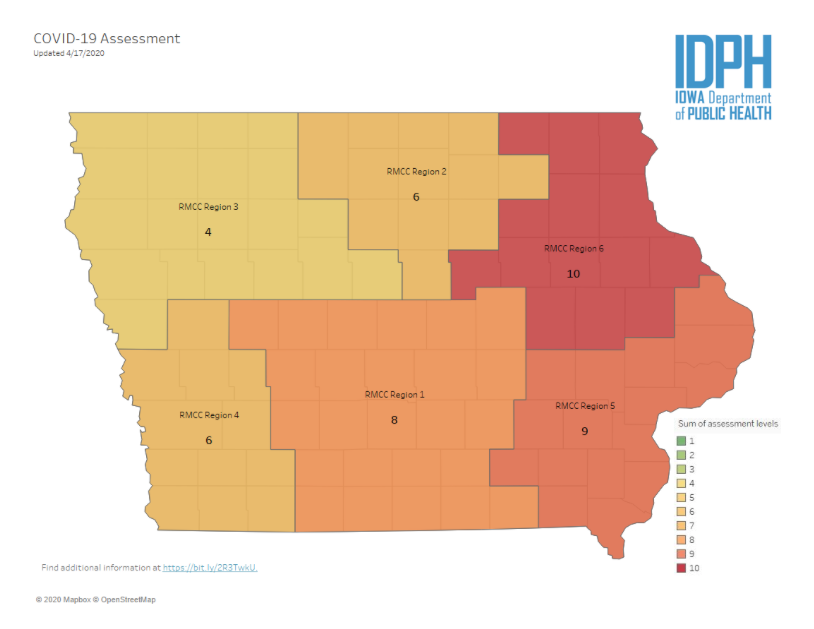
UPDATE: The central Iowa region moved back up to 9 on the map published on April 19.
In Perencevich’s view, a statewide shelter-in-place order in mid-March could have quickly turned things around in Iowa, due to lower population density here than in major metro areas. “But for some reason, we are slow-walking social distancing and hurting the economy.” He disputes the idea that stronger mitigation efforts are bad for business, telling the Des Moines Register, “It’s not very business-friendly to have kind of half-policies for many months versus really aggressive policies for short periods.”
“IT IS STARTING TO FLATTEN”
When asked for the latest IDPH assessment of Iowa’s peak date, Deputy Director Reisetter told reporters on April 9 that the department’s “projections about that haven’t changed.” She also shared, “I can tell you, when we’re looking at our epidemiological curve, it is starting to flatten, which means that Iowans are listening.” A short while later, she repeated, “We are starting to see our curve kind of flatten out, which is exactly where we wanted to be.” Reisetter chalked the trend up to Iowans “doing what we’re asking them to do: stay home as much as possible.”
Not everyone agreed. Perencevich told Bleeding Heartland in an April 11 email,
As far as other measures of “flattening the curve”, I can only comment on what is publicly available. And based on what is publicly available we are seeing encouraging signs, but no evidence that the curve is flattening. We would expect to see cases completely stable and declining for several days, perhaps for a week, before we can confirm flattening. And even when we do see flattening, and I hope this is soon, we will need widespread and unrestricted (no criteria) testing before we can believe that it is safe to resume normal activities.
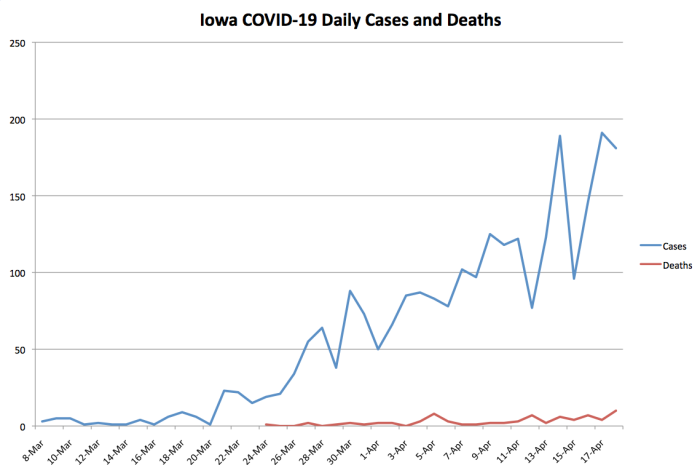
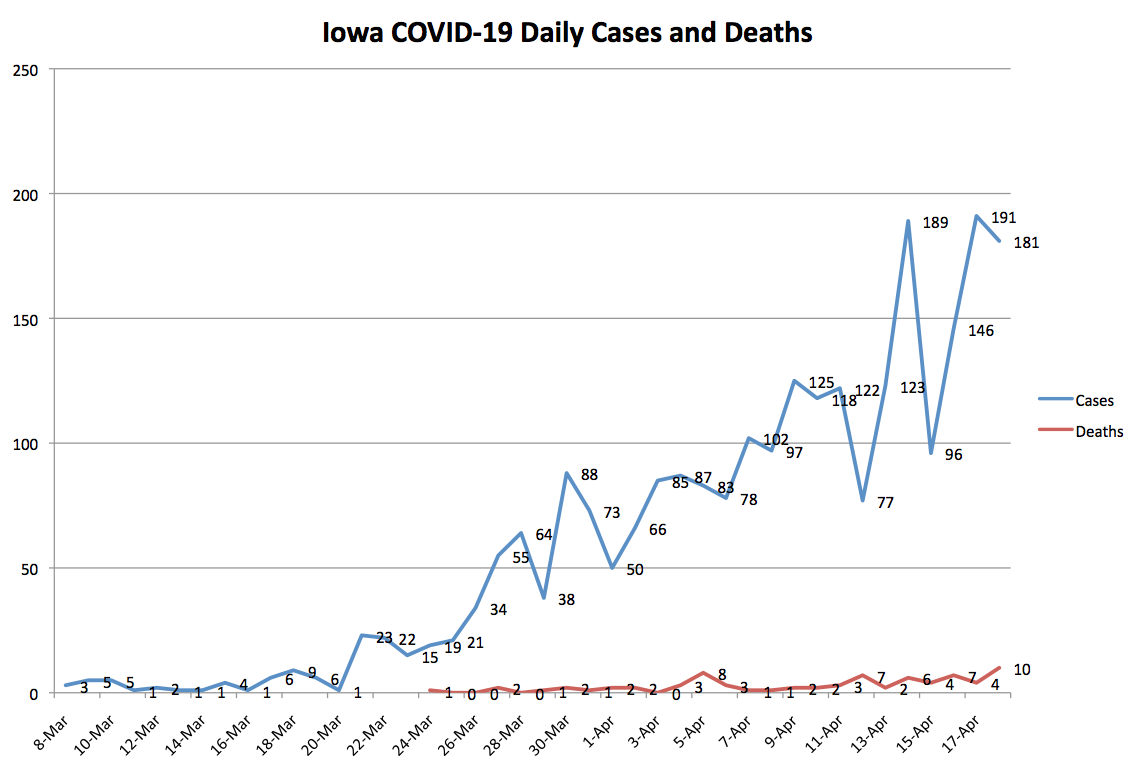
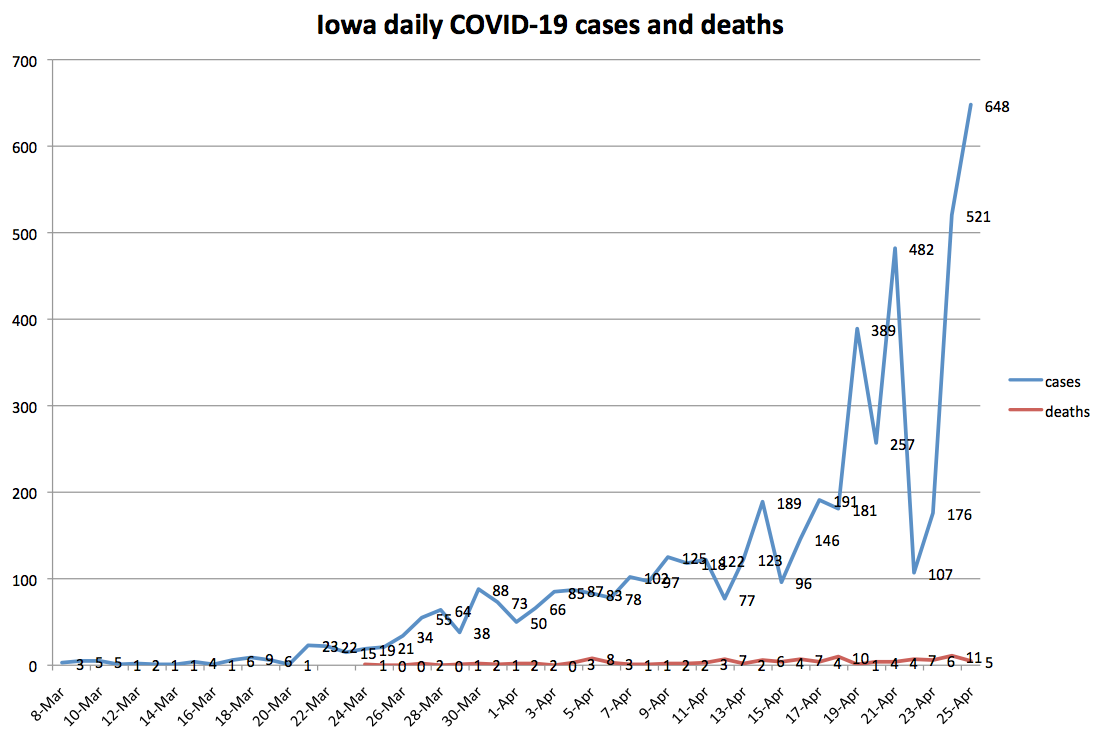
I plotted the daily totals for reported COVID-19 cases and deaths. (Worth noting: the official death toll is missing at least one death the Washington County coroner attributed to coronavirus.) This curve doesn’t appear to have flattened.
I noticed one bit of good news after plotting the total number of confirmed cases.
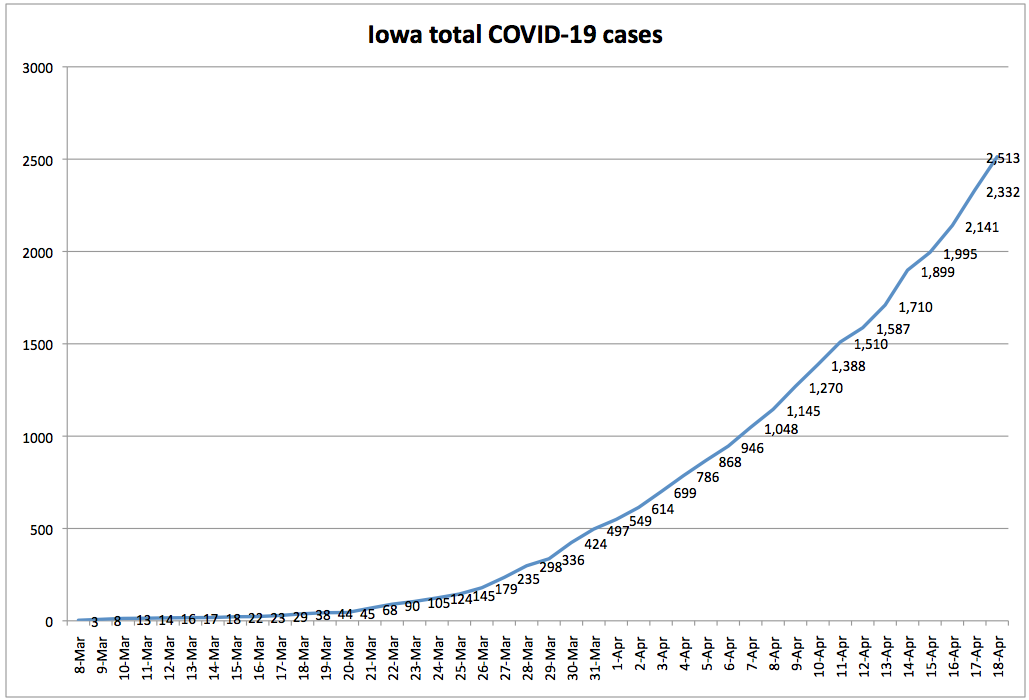
In a post for this website last month, Joe Gorton explained the importance of using “exponential (doubling time) numbers” to evaluate Iowa’s progress in slowing the spread of the virus.
Looking at the total number of cases each day, you can see that Iowa’s doubling time for reported COVID-19 infections has lengthened from three to four days during the last week of March to eight or nine days more recently. That’s a welcome trend, though it could be a function of limited testing rather than a sign that infections are spreading more slowly.
Iowa plans to ramp up daily testing capacity, which should turn up more known cases, particularly in communities with meatpacking plants and long-term care settings, where rapid-testing machines are being deployed.
So why does Reynolds keep talking about “encouraging” or “positive signs”?
I suspect the assessment stems from the health department’s data on symptoms onset.
A MISLEADING “EPI CURVE”
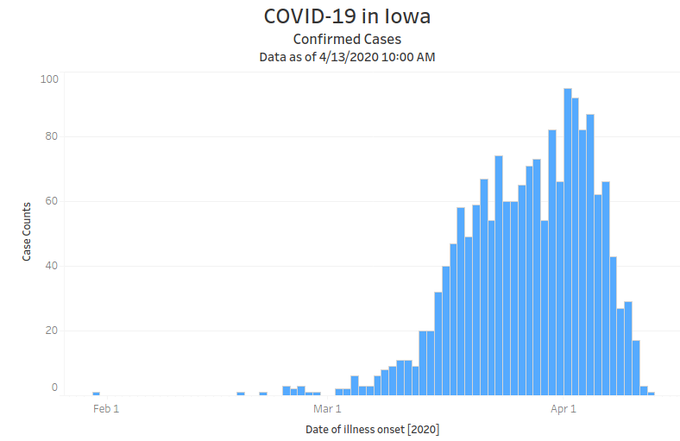
The state’s updated COVID-19 dashboard, rolled out this past week, allows users to click on “Epi Curve.” Here’s the latest version, incorporating data up to the morning of April 17.
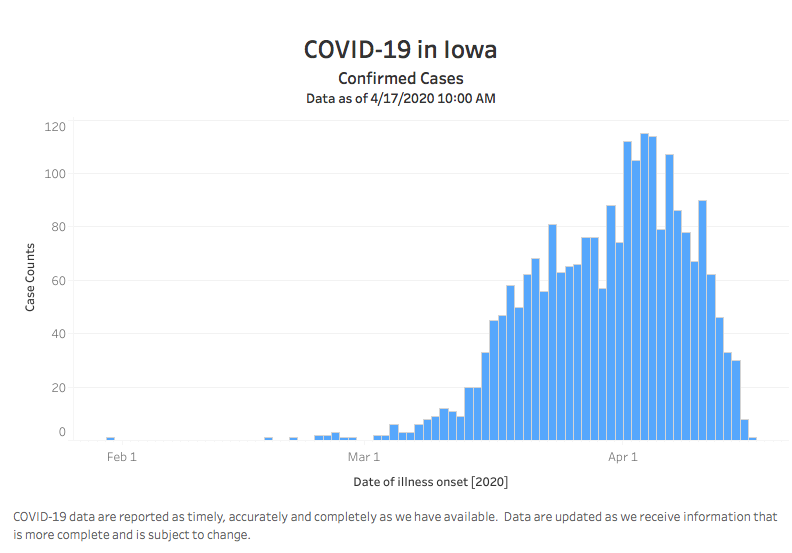
A casual observer would likely assume Iowa has turned the corner and has been reporting fewer coronavirus cases daily for a week or so. After all, it says near the top, “Confirmed Cases.”
But this graph doesn’t show cases on the date they were confirmed, the number most often cited in the news media. In smaller font below the bar graph, the “x” axis is labeled “date of illness onset.” That’s usually self-reported by patients who seek medical attention.
Dr. Megan Srinivas, an infectious disease doctor in Fort Dodge, told Bleeding Heartland that epidemiologists do look at the symptom onset curve. However, “Since most people don’t seek care until a few days after initial appearance of symptoms, the most recent few days are going to be skewed and look disproportionately low.”
It would be “misleading” to present this kind of curve without explaining the limitations of the data, she added.
You’d have to take into account the incubation period, which this doesn’t if it reports up to today. You should exclude the last week from this curve to take into account. You could argue for even up to 14 days given that incubation can be that long, but at the very least you have to exclude the last 5.6 days (median incubation period).
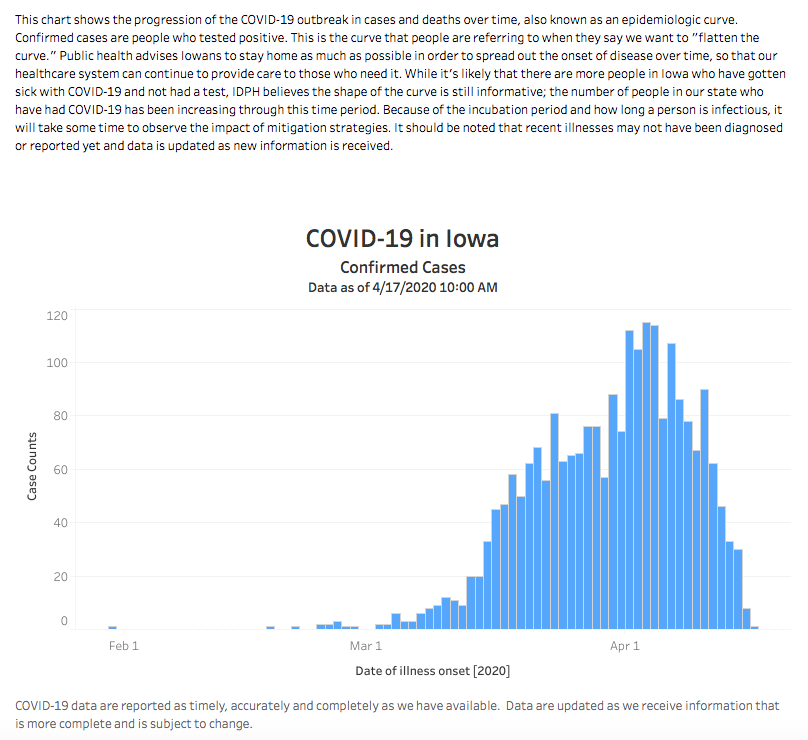
A wider view of Iowa’s epi curve reveals fine print above the blue bars. The last sentence in that paragraph: “It should be noted that recent illnesses may not have been diagnosed or reported yet and data is updated as new information is released.” How many people will notice that disclaimer or understand what it means?
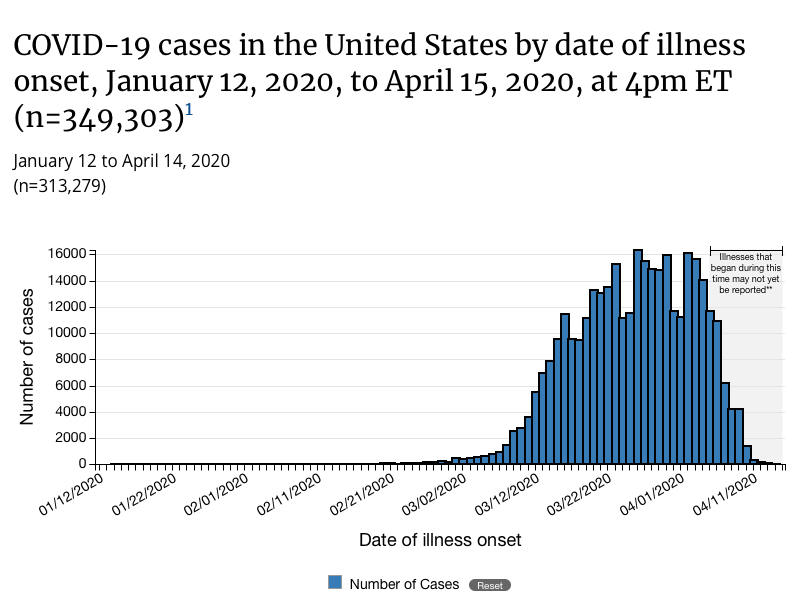
The federal Centers for Disease Control website makes the limitations of symptoms onset data more clear on its graph. Here’s the latest version posted. Note the words on the graph, right above the data listed for the previous ten days: “Illnesses that began during this time may not yet be reported.”
Ditchwalk noticed another bit of sleight of hand on Iowa’s official website. The first epi curve posted, incorporating data up to April 13, had a “y” axis going up to 100 cases a day.
Eyeballing that graph, it looks much like the most recent one, which might give the impression cases aren’t increasing. Not so. The current epi curve, incorporating data up to April 17, has a “y” axis going up to 120.
UPDATE: The upper end of the “y” axis increased to 140 on April 22. Without looking carefully, though, you wouldn’t notice the difference.
MIXED MESSAGES CONTINUE
Mixed messages have become a consistent feature of Reynolds’ COVID-19 news conferences. For weeks, the governor, Reisetter, and Dr. Pedati repeatedly reminded Iowans to “stay home if you’re sick,” which glossed over the reality of asymptomatic spread and implied people could go about their normal business if they didn’t feel sick.
For me, one of the most terrifying exchanges occurred on April 2, when KWWL’s Ron Steele asked, why not err on the side of caution now, rather than risking a surge later? Reynolds defended her approach before turning it over to Pedati. You can watch the clip here.
Toward the end of a meandering answer, Pedati said,
I think the other piece to keep in mind is that when you think about the use of public health mitigation strategies–which is what we have right now while we await additional tools like medications or vaccines–these strategies have to be put in place carefully and consistently in order for them to be effective. [Reynolds nods in the background]
And so in some ways it wouldn’t be enough if somebody, you know, just sort of stopped in place for two weeks. [Reynolds shakes head to signify agreement]
What we would do in that situation is delay a peak. [Reynolds nods] And what we’re trying to do is flatten that peak.
It’s not that I want to push it out. It’s that I want to keep as many people as healthy as possible for as long as possible.
And so that’s in part why we think about using the strategies we have, and also why–I know this has been a hard time for everybody, but it is so important that we all remind each other, wash our hands, cover our cough, and stay home when we’re sick.
Here’s hoping Pedati either misspoke or was spinning her audience to divert attention from deficiencies in our policy. The alternative is that Iowa’s state medical director believes stopping in place for two weeks would “delay a peak” in COVID-19 infections.
On the contrary: states that issued early shelter-in-place orders flattened their curves and have likely already passed the peak infection point. Look at Minnesota, where the governor issued a shelter-in-place order on March 27. Despite having a larger and denser population than Iowa (most residents live in the Twin Cities metro), Minnesota has fewer confirmed COVID-19 cases and half as many per capita. According to IHME, our neighbor to the north will experience hundreds fewer total deaths, and just passed peak demand for hospital resources.
Pedati rightly noted that mitigation strategies are more effective when implemented “carefully and consistently.” So why is Iowa setting different rules for some counties when viruses don’t recognize county lines? Why are we using an arbitrary matrix that can lower a region’s score, even as cases multiply?
Since early April, Reynolds has more often urged Iowans to “stay home if you can” or go out only for essential errands. But she typically avoids giving a straight answer about tightening restrictions. Here’s the full transcript of her response to David Pitt of the Associated Press, who asked on April 7 whether Reynolds would issue a shelter-in-place order if a region scored 10 on the matrix.
Much like Iowa is not New York or California or New Jersey, we have different areas of the state that are experiencing different outbreaks. And so it would be irresponsible for me to just do a statewide, when according to Dr. Fauci, many of the mitigation efforts that I have put in place are actually aligned with the results that they’re trying to get.
And we’re doing it on a community, county, region basis. We have the ability to take a look at what we’re seeing happening across the state.
And by using these metrics, then, you know, we will be able to, if we hit a certain point where we think we have to take additional actions or additional steps, we can do that.
But as this moves across the state–and hopefully we don’t see that happen on the western side, or the north-central part of the state. But if it does, and things start to stabilize, we start to see a decline, and we’re actually experiencing the outcomes that we want, we might be able to start to open up the eastern side of the state, based on the data and the metrics that we’re looking at at that time.
So, you know, so we believe in what–you know, I believe in the data, I believe in the strategy. I think it’s the right way to move forward. And we are working on what that looks like. There are different variables that we can take for the next step. So be rest assured, it is–you know, if we feel that that needs to be done, and that’s the recommendation from the experts, we will move forward.
But again, remember: the metric is a piece of what we’re looking at. There’s other assumptions that are going into the recommendations that are being made from the epidemiologist team, the Iowa Department of Public Health, based on the CDC guidelines, which they based a lot of their metrics on.
Again, I think the more we can do that, it’s more consistent, across not only the state of Iowa, but across the country. So, we are working on what that looks like, and we will be ready to go if and when we need to do that.
Which is it, Governor? Is it “irresponsible” to issue a statewide order rather than one tailored to hardest-hit regions? Or should we strive for “consistent” mitigations across Iowa?
And what are the “other assumptions” going into the recommendations besides the “metrics” Reynolds and IDPH officials had cited at previous news conferences? The Des Moines Register’s Nick Coltrain tried to follow up on that a couple of days later. The governor complained, “I think sometimes everyone is getting so hung up on metrics,” then dodged the question with a laundry list of social distancing and hygiene practices.
Reynolds’ closing remarks at her most recent news conference on April 17 struck a hopeful note which seemed to undermine her call for Iowans to keep staying home.
After thanking viewers for tuning in to her daily briefings, Reynolds said,
And I know this has been a tough week and this has been a tough road with some really tough decisions that’s impacting Iowans and families and businesses all across the state.
And while this has been a really tough week, I want you to know there are a lot of really positive signs out there as well. And this team is not only working hard to make sure that we’re taking care of vulnerable Iowans, not overwhelming the health care system, and really making sure that we flatten the curve.
But we also every day are looking at ways that we can open it back up, this economy, and let Iowans get out there and do what they do so well.
So, hang in there, there’s, you know, it’s been a tough week, but there’s also a lot of positive signs that we’re seeing out there. So if you just hang with us for two more weeks and be responsible, and stay at home if you’re sick, only go out for essential services, work from home if you can, and really do your part, then we’ll do our part, and we’re going to get Iowa opened up again. So thank you, I appreciate that.
The pep talk would be more convincing if Iowa officials could show us details about the “positive signs,” or better yet, modeling to back up her suggestion that Iowans just need to hunker down for “two more weeks.”
We’ll find out in May whether state officials’ recent upbeat assessments were more accurate than the “first peak” we heard about three weeks ago.
UPDATE: The IDPH announced 389 additional COVID-19 cases on April 19, bringing Iowa’s total to 2,902. It was roughly double the previous highest single-day count. One additional death raised that total to 75. The governor should not lead people to expect we are anywhere close to reversing course on mandatory closures.
Iowa recently expanded testing criteria to include “surveillance testing” of meatpacking plant employees, whether or not they have respiratory symptoms. A news release said,
261 or 67% of today’s 389 additional positive cases can be attributed to surveillance testing of meat processing facilities. That includes over 500 completed surveillance tests of Tyson employees and over 500 completed surveillance tests of National Beef employees, for a total of 84 positive and 177 positive respectively.
APRIL 22 UPDATE: The state announced 257 new cases on April 20, 482 on April 21, and 107 on April 22. The official death toll is now 90, and total cases stand at 3,748.
FINAL UPDATE: Case counts have continued to climb, especially in counties affected by meatpacking plant outbreaks. Nevertheless, Reynolds announced during her April 24 news conference that “it’s time” to start relaxing restrictions in parts of Iowa.
While there are some areas in our state where virus activity is still high, we have many more areas where it’s manageable or even minimal. And this presents an opportunity to start to open Iowa back up in a phased and responsible manner.
At the same media availability, Reisetter predicted that COVID-19 cases would peak in Iowa in two to three weeks.
_________________
Appendix 1: Iowa Department of Public Health Guidance for Implementing Public Health Mitigation Measures
Appendix 2: State Auditor Rob Sand’s April 4 letter to Governor Reynolds
2 Comments
389 new cases today
This is really worrisome. I hope she actually does something now.
Leslie Dow Sun 19 Apr 8:15 PM
Doubling Time
I can’t digest all the news about covid spread but I can track doubling time. A month ago many graphs I saw showed how quickly the virus was doubling its number of victims. Really steep lines on those graphs showed doubling times of three or four or five days. We were told how nice it would be if we flattened the curve so that it took longer to double the number of cases.
I started writing on my calendar. On March 16 we had 29 cases. That doubled to 68 on March 21–five days later. On March 23 we had 105 cases. It doubled to 235 by March 27–only four days later. On March 30 we had 424 known cases in Iowa. It doubled to 868 but it took six days.
On April 7 we had topped a thousand cases. We did not top 2000 until April 16. That was 9 days. Today we can compare our nearly 3000 cases to the day we had just over half that at 1510. That was on the 11th–eight days ago.
Those early scary charts did not even show lines as flat as 8 day doubling times. But now that we have such a line, no one is reassured.
iowavoter Sun 19 Apr 10:36 PM