Evan Burger continues his series on redistricting with analysis of some of the reddest and bluest possible Congressional districts.
On August 12, the Census Bureau released the “PL 94-171 Redistricting Data File” – the official population counts of every precinct, city, county, and state in the country, as of April 1, 2020.
As I wrote last weekend, Iowa’s redistricting process can now start in earnest – and members of the public can get a clearer view of what districts are possible. For today, I’ll focus on the implications for Iowa’s Congressional maps. Future articles will contain similar analysis at the legislative level.
Surprises in this dataset
The first valuable piece of information in the PL 94-171 data is which areas of the state grew faster than expected (and therefore will get more representation at all levels of government) and which shrank or grew slowly (and will get less representation).
Prior to today’s data release, the best estimates of current county- and city-level population were from the Census Bureau’s Population Estimates Program (PEP). As the name implies, this program produces annual estimates of county and city populations, based on the previous decennial census. Last month, the bureau released their 2020 PEP estimates, which were produced by applying estimates of population growth or decrease to 2010 census population counts.
You can find a table of how each Iowa county’s 2020 Census count differed from their 2020 PEP estimate here. The short version is that most counties varied by only a few percent from their estimated population. Of the ten largest counties, Woodbury (Sioux City area) and Dallas (far west Des Moines suburbs) had the biggest difference: the decennial count for each was 3 percent higher than the 2020 PEP estimate. Johnson (Iowa City) and Polk (Des Moines metro) were the large counties that were smaller than expected, but only by 1,880 people and 886 people, respectively. Overall, Jefferson County (containing Fairfield) was the biggest outlier, coming in a whopping 15 percent under the 2020 PEP estimate.
Overall, these census numbers look close to what was expected – I don’t see any massive undercounts of college students due to closed universities, for instance. But the exact numbers are still important, because as we will see, a difference of even 100 people in a county’s population can make or break a proposed LSA map.
Applying population equality
Seeing which areas grew faster or slower than expected is useful, but the more interesting analysis that we can do with the PL 94-171 dataset is to narrow the range of possible districts. Back in February, I made predictions about what Congressional districts were possible based on the information we had then.
Today’s analysis is based on the legal principle of equal population for Congressional districts. As I wrote in February:
Chapter 42.4 of Iowa Code says that “No congressional district shall have a population which varies by more than one percent from the applicable ideal district population, except as necessary to comply with Article III, section 37 of the Constitution of the State of Iowa.” The ideal district population is “determined by dividing the number of districts to be established into the population of the state reported in the federal decennial census.”
However, as described in the excellent Legislative Guide to Redistricting in Iowa, published by the Legislative Services Agency (LSA), federal courts have applied an even stricter standard to population variation between districts, based on the concept of “overall range percentage variance.” That metric is defined as: “the difference in population between the most populous and least populous districts in a redistricting plan[…] divided by the ideal population, expressed as a percentage.” Federal courts have rejected redistricting plans with overall range percentage variance as low as 0.69 percent, and accepted redistricting plans with overall range percentage variance as high as 0.73 percent.
Thanks to Iowa’s nonpartisan redistricting process, our Congressional maps stay well within both the 1 percent limit in the state constitution, and the stricter standard applied by federal courts. The overall range percentage variance of the congressional maps approved in 2011 was 0.01 percent. In other words, the LSA managed to draw four Congressional districts where the largest had a population of 761,624 and the smallest had a population of 761,548 – an impressive feat that speaks to the power of modern redistricting software, and to the LSA’s commitment to equal district populations.
Even if Republicans manage to override the current redistricting process this year – either by exercising their ability to amend the third redistricting plan presented by the LSA, or by changing the statutory process outright – the guardrails established by federal courts mean we can be certain that the districts will be virtually equal in population.
In other words, there are three separate standards of population equality at play in evaluating a proposed district. In order of increasing strictness, they are:
- Statutory standard: each Congressional district must have less than 1 percent variance from the ideal district population. (This year, Iowa’s ideal district population is 797,592.)
- Judicial standard: a statewide congressional district map must have a reasonable overall range percentage variance (OPRV), where reasonable has been interpreted as no more than 0.73 percent.
- LSA standard: No exact definition, but the highest OPVR of any LSA-produced map was 0.05 percent in 1991. To be safe, let’s say they will only propose maps with OPVR less than 0.06 percent.
Today’s census data allows us to say with certainty which possible maps meet each of these standards. Maps that do not meet the statutory standard will probably not even be proposed, since on their face they do not comply with Iowa Code. Maps that meet the judicial standard have a good chance of surviving a court challenge, but would require the legislature to amend third-round LSA maps, because the LSA will only propose maps that meet all three standards.
(One note: based on Center Square’s interview with Iowa House Speaker Pro Tempore John Wills, it is looking more likely that legislative Republicans plan to drag the redistricting process out, potentially to a third round where they can amend the maps. Center Square’s article confirms my warning that we shouldn’t count on the Iowa Supreme Court to exercise their authority to take over map-drawing on September 15.)
Keep in mind that population equality is not the only standard used in evaluating maps in Iowa – the code also defines two measures of compactness. However, population equality is the first standard to be applied, so generally speaking we can use population equality to narrow the range of possible districts, and then compactness to evaluate maps within that range.
Possible maps
The analysis below is focused on three key areas of the state: Polk County, Johnson County, and northwest Iowa. In each case, I look at the reddest district that is possible to draw including that area, and the bluest district possible to draw that includes that area. This method sets the range of possibilities for partisan outcomes – the new Polk-based district, for instance, might not look like any of the options I describe below, but it will fall somewhere between those poles on the partisanship spectrum.
To calculate partisanship, I looked at how the counties that make up each proposed district voted in each of the last three Congressional elections. This is a different way of calculating partisan lean than the more common partisan voting index, but I believe it is more accurate since it considers only Congressional voting behavior, not presidential voting behavior.
One other somewhat complicated methodological note: since these are maps of individual districts, I can’t calculate overall range percentage variance (OPRV), since that standard requires a statewide map to calculate. However, we can calculate the minimum OPRV of a statewide map that includes a given individual district using this formula:
IF x>797592
THEN y=x-(797592-(x-797592)/3))/797592
ELSE y=797592+((797592-x)/3))-x)/797592
Where x is the population of the proposed district and y is the minimum OPRV of a map that includes that district.
Polk County
With a population of almost half a million, Polk County will dominate whatever congressional district it is placed into. Polk’s size also means there are fewer possible districts that include it.
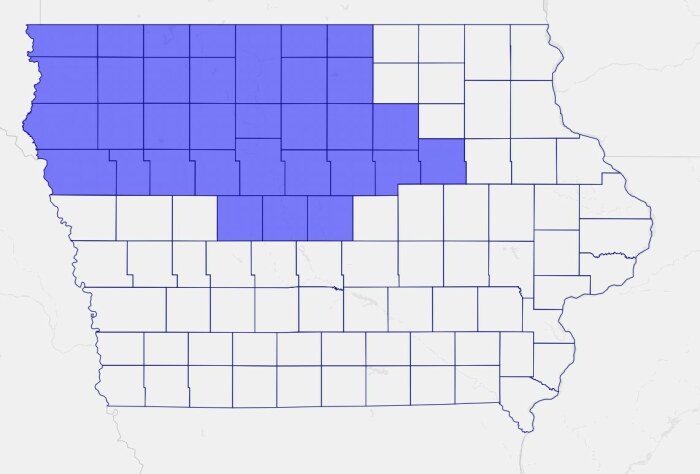
1A: Polk-Johnson
Population: 801,840
Variance from ideal: 0.53 percent
Minimum OPRV: 0.71 percent
Meets statutory standard: YES
Meets judicial standard: YES
Meets LSA standard: NO
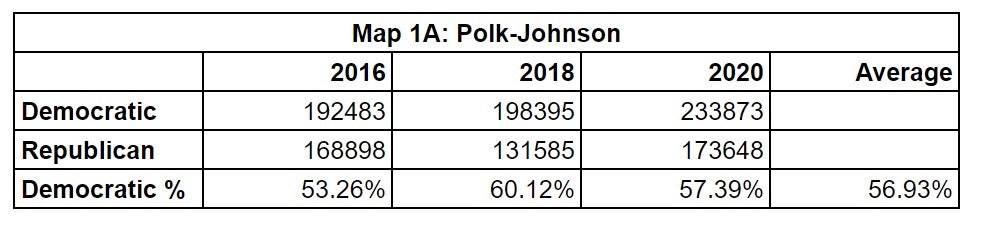
This is the bluest Polk-based district that meets the judicial standard of equality.
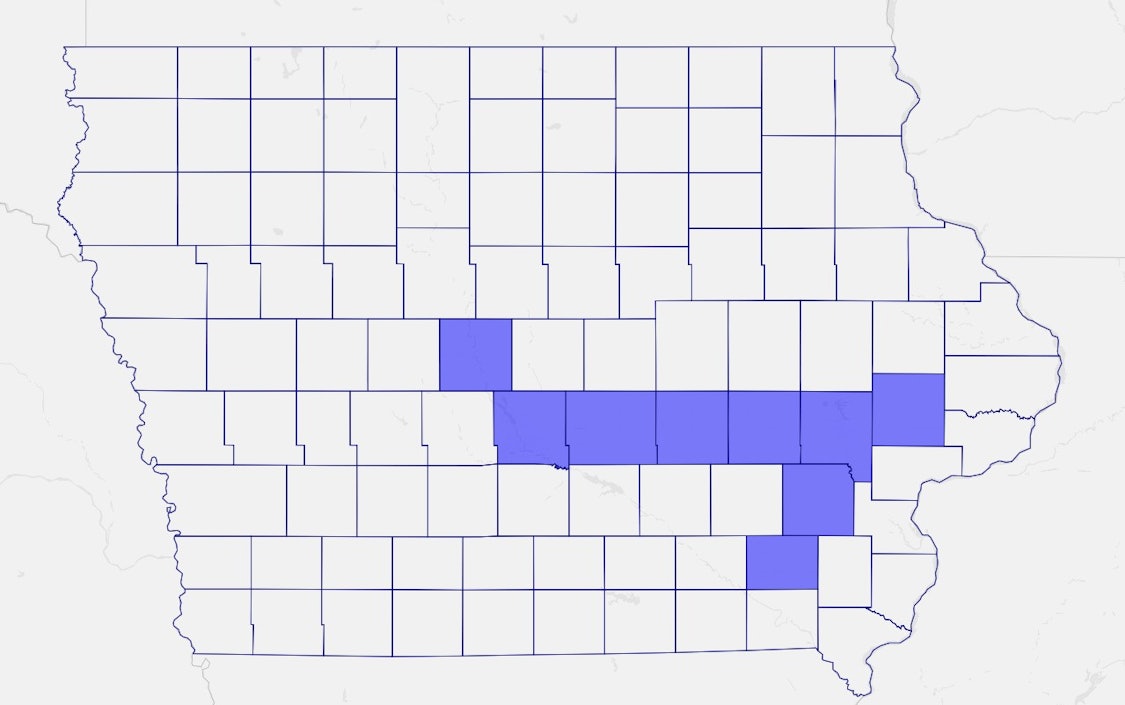
1B: Polk-Rural
Population: 796,963
Variance from ideal: -0.08 percent
Minimum OPRV: 0.11 percent
Meets statutory standard: YES
Meets judicial standard: YES
Meets LSA standard: NO
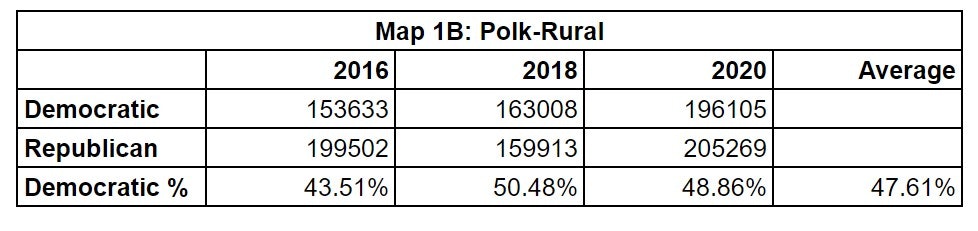
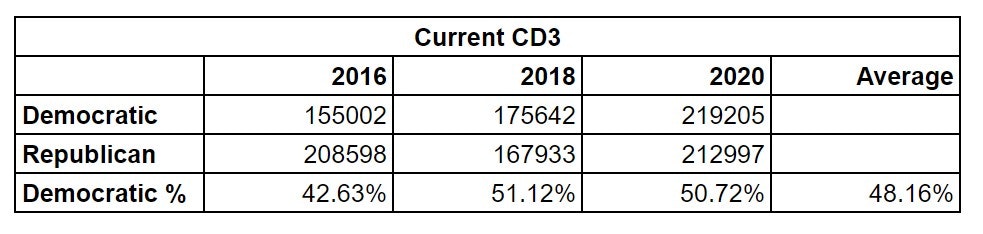
On the other end of the spectrum, this is the reddest Polk-based district that meets the judicial standard.
But it is only slightly redder than the current IA-03:
1C: Polk-Story-Dallas
Population: 799,712
Variance from ideal: 0.27 percent
Minimum OPRV: 0.35 percent
Meets statutory standard: YES
Meets judicial standard: YES
Meets LSA standard: NO
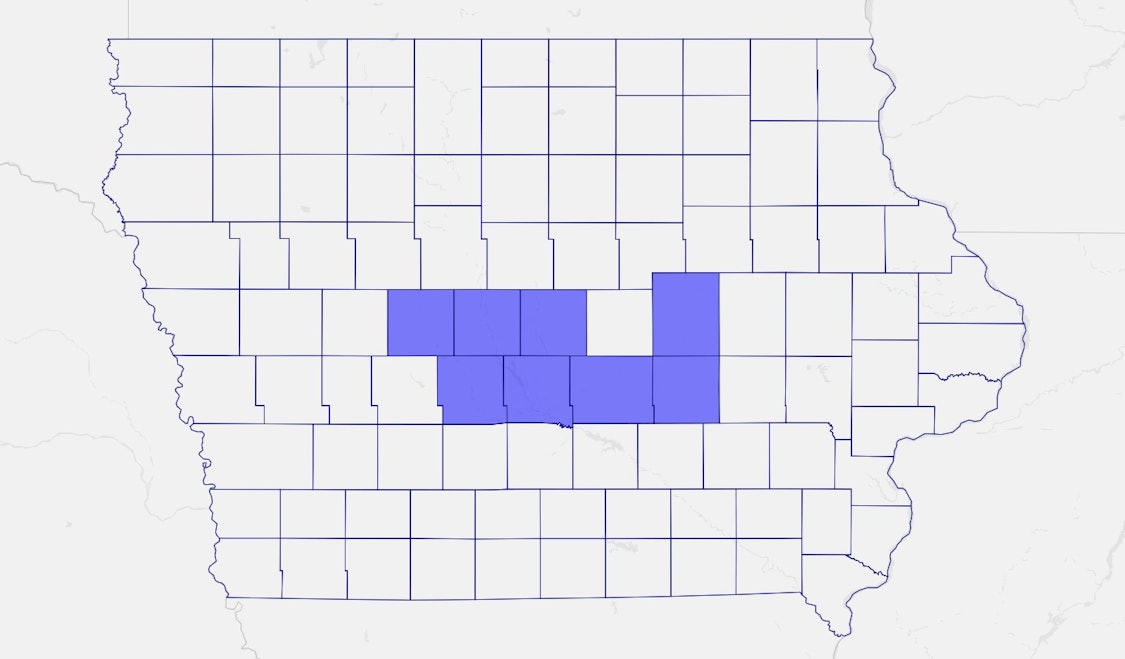
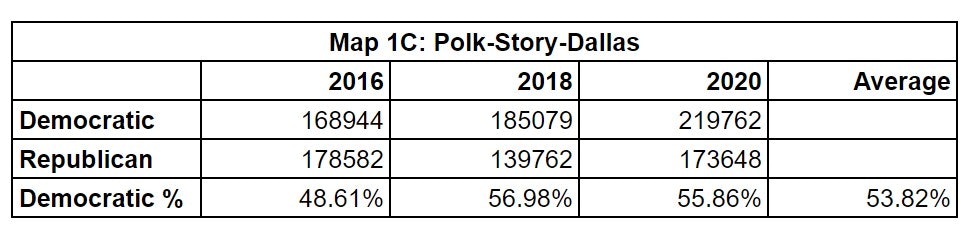
One middle outcome would be a district that includes Story and Dallas in addition to Polk, similar to this one.
Polk summary
The range of possibilities for Polk County runs from very blue (Map 1A) to slightly redder than the current IA-03 (Map 1B), with many options in between (such as Map 1C). Democrats can rest easy that at least one district in the state will be competitive: whichever district includes Polk.
Johnson County
As the bluest county in the state, and also the fourth largest, what happens to Johnson will drastically impact the rest of the map.
2A: Johnson-Linn-Scott-Black Hawk
Population: 799,226
Variance from ideal: 0.20 percent
Minimum OPRV: 0.27 percent
Meets statutory standard: YES
Meets judicial standard: YES
Meets LSA standard: NO
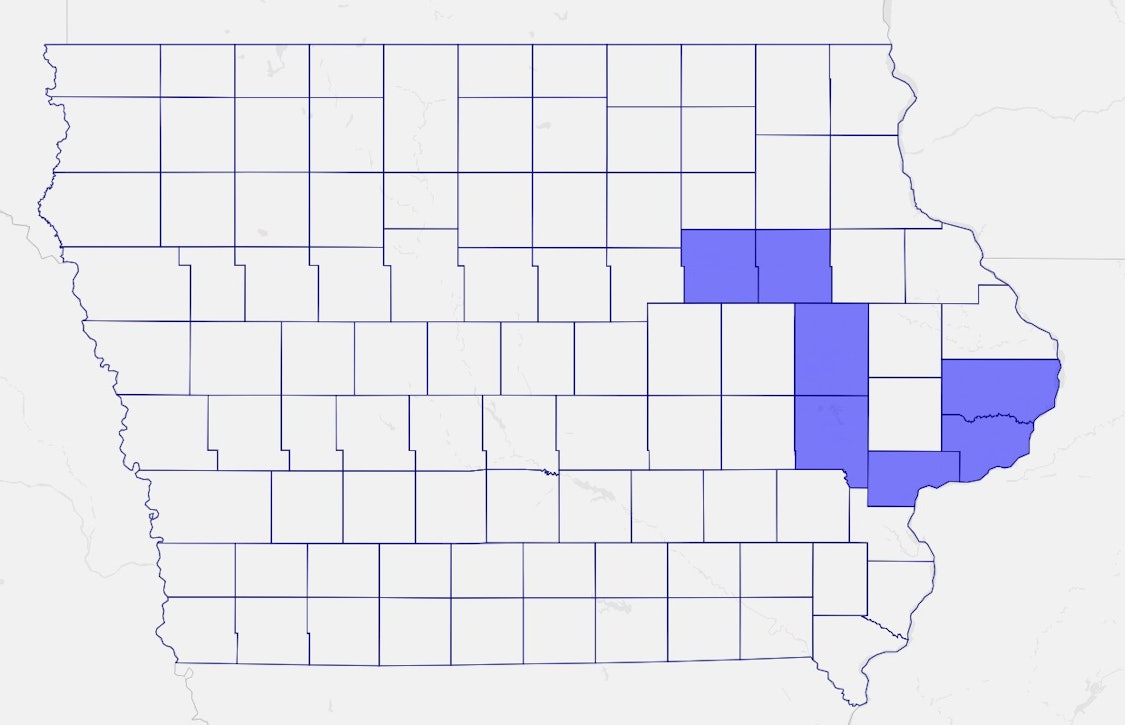
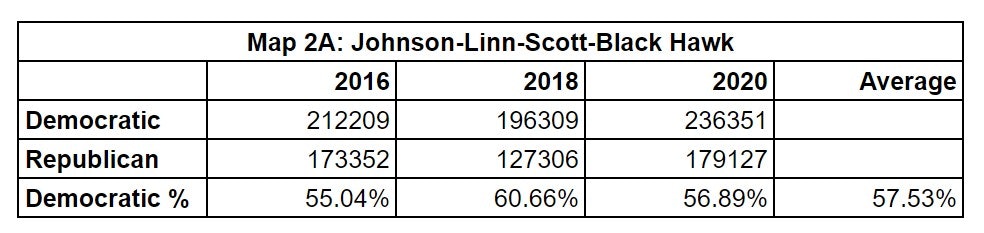
Johnson has an even bluer possibility than Map 1A: being lumped together with Linn, Scott, and Black Hawk, three other big, blue counties. Politically, Republicans would never approve a map that included a district like this, and it scores terribly on compactness, but this map sets the outer bound of how blue a Johnson-based district could be.
This district would be almost as blue as the current fourth Congressional district is red:
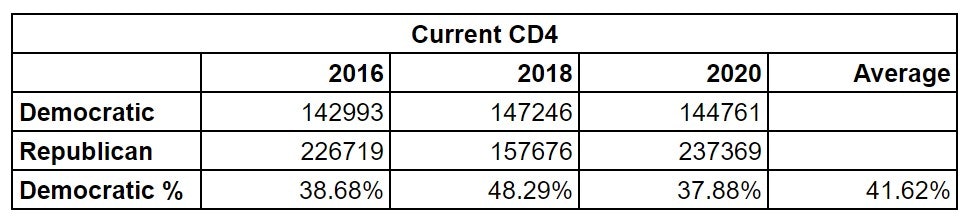
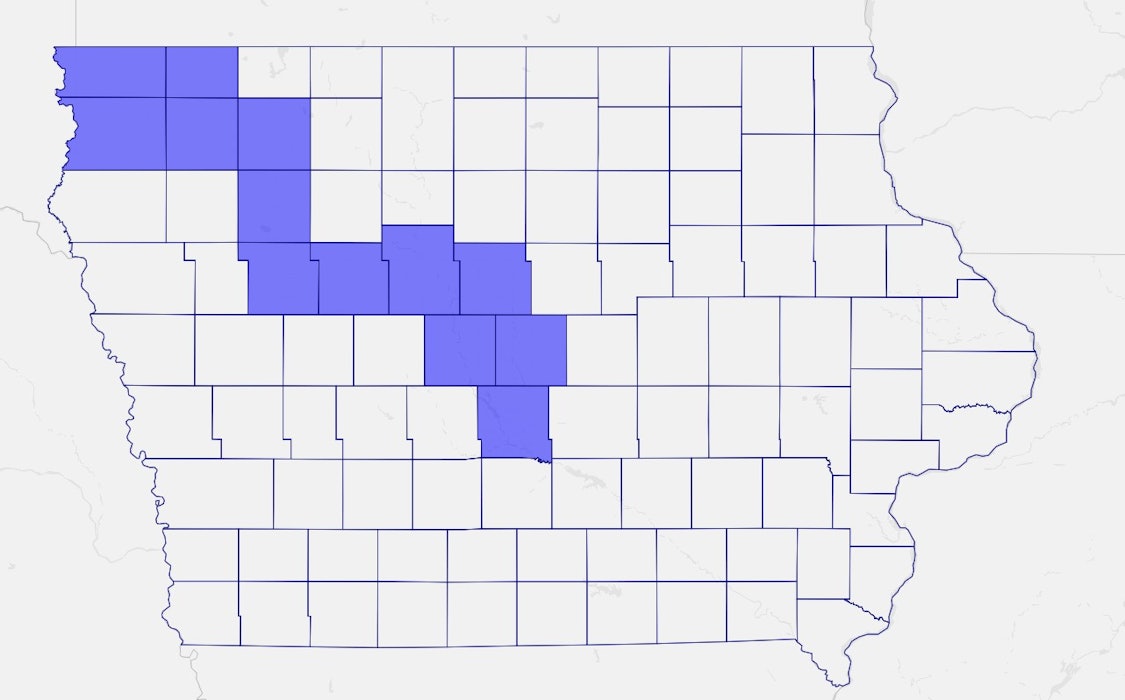
2B: Johnson-Rural
Population: 797,309
Variance from ideal: -0.04 percent
Minimum OPRV: 0.05 percent
Meets statutory standard: YES
Meets judicial standard: YES
Meets LSA standard: YES
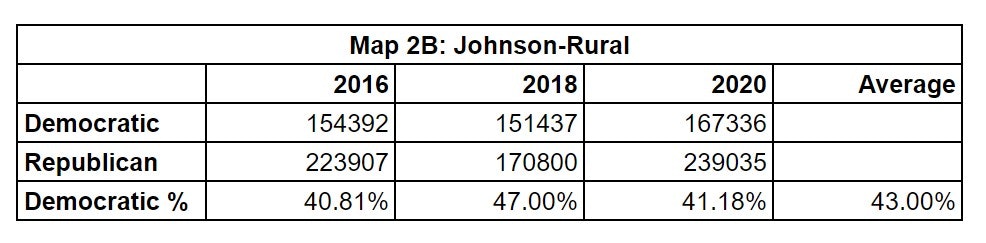
Unlike Polk, it is possible to include Johnson in a deep red district, albeit one that would fail every measure of compactness. This district is an excellent example of why the compactness standard exists. It is the only map considered here that even has a chance of meeting the LSA standard of population equality, but anyone who looks at it would say that it isn’t a fair map.
Johnson summary
Iowa Republicans consider Johnson County their mortal enemy, and would probably love to drown out Johnson’s Democratic votes in a red district. As this analysis shows, it is possible to do just that – but it would require ignoring Iowa’s standards of compactness.
Northwest Iowa
The third key area I’ll look at today is northwest Iowa, specifically the SOLO counties (Sioux, O’Brien, Lyon, and Osceola). This is the reddest part of the state, and is currently part of deep-red IA-04.
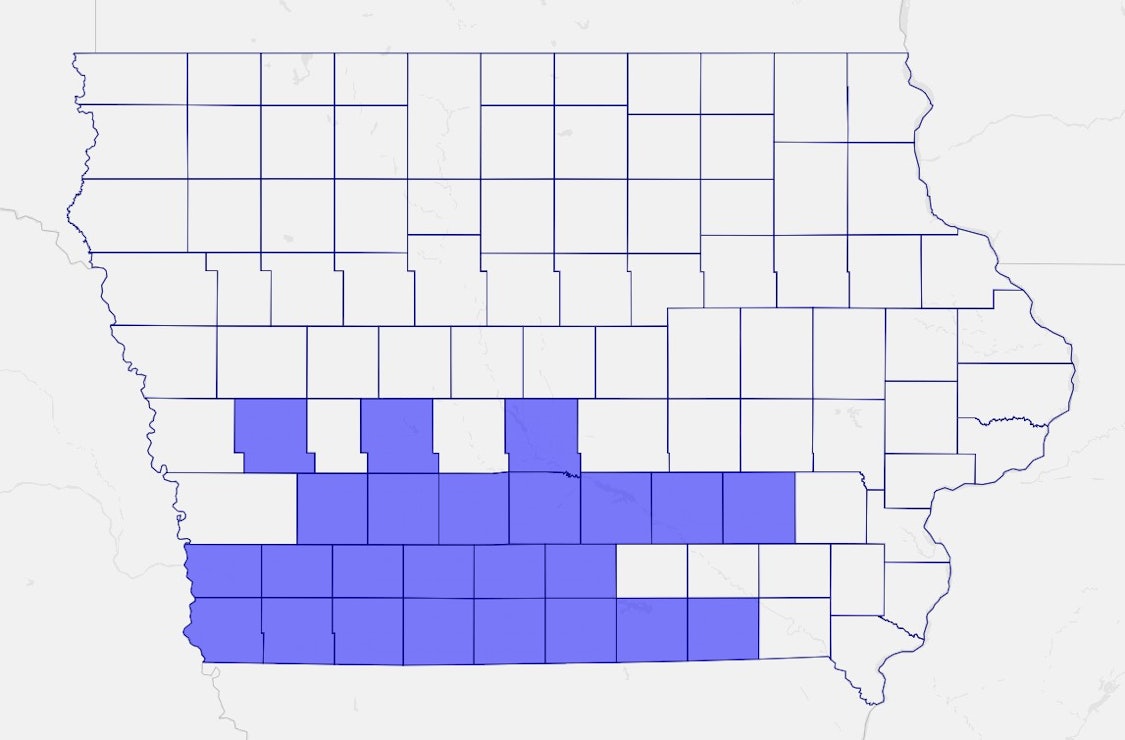
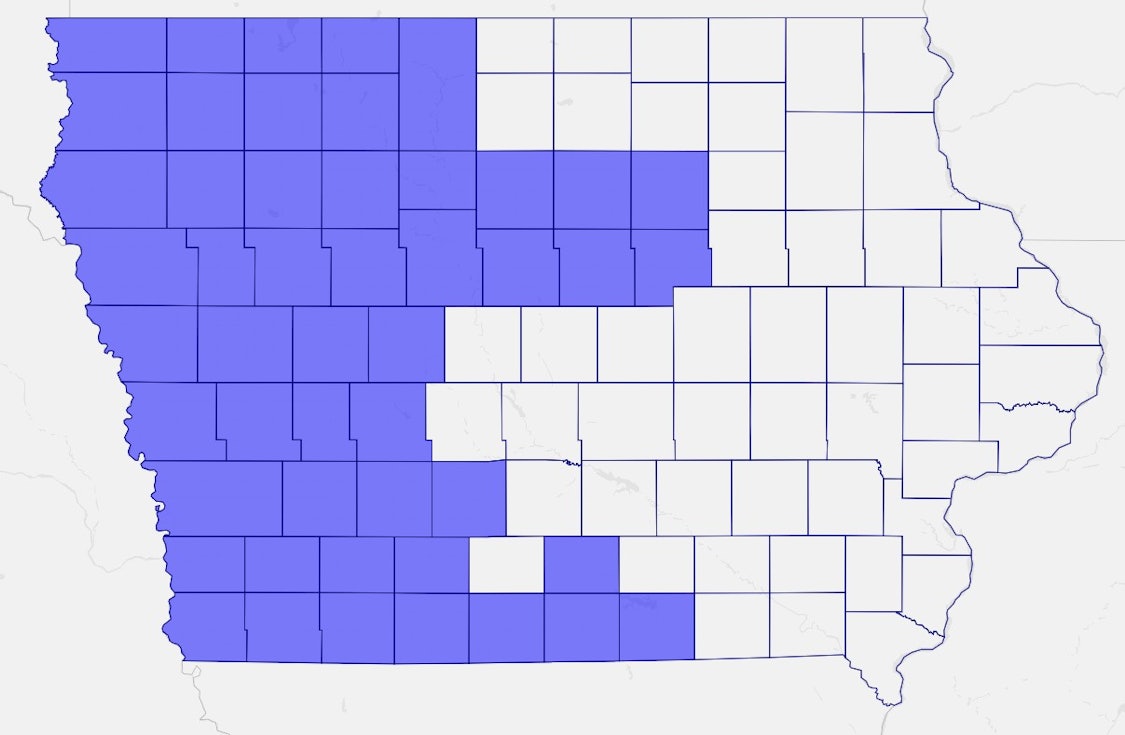
3A: SOLO-Story-Polk
Population: 794,819
Variance from ideal: -0.35 percent
Minimum OPRV: 0.46 percent
Meets statutory standard: YES
Meets judicial standard: YES
Meets LSA standard: NO
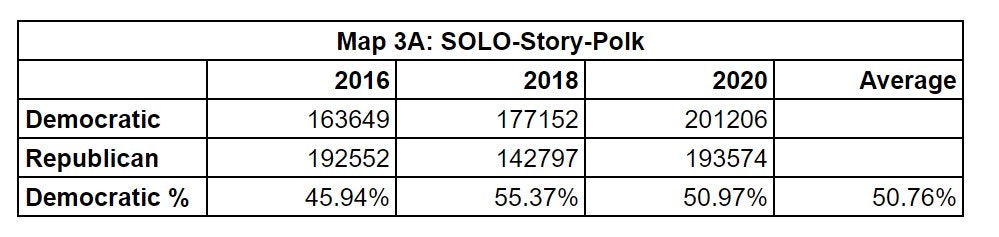
It is possible to draw SOLO into a blue district, if you make a beeline from the northwest corner to Polk.
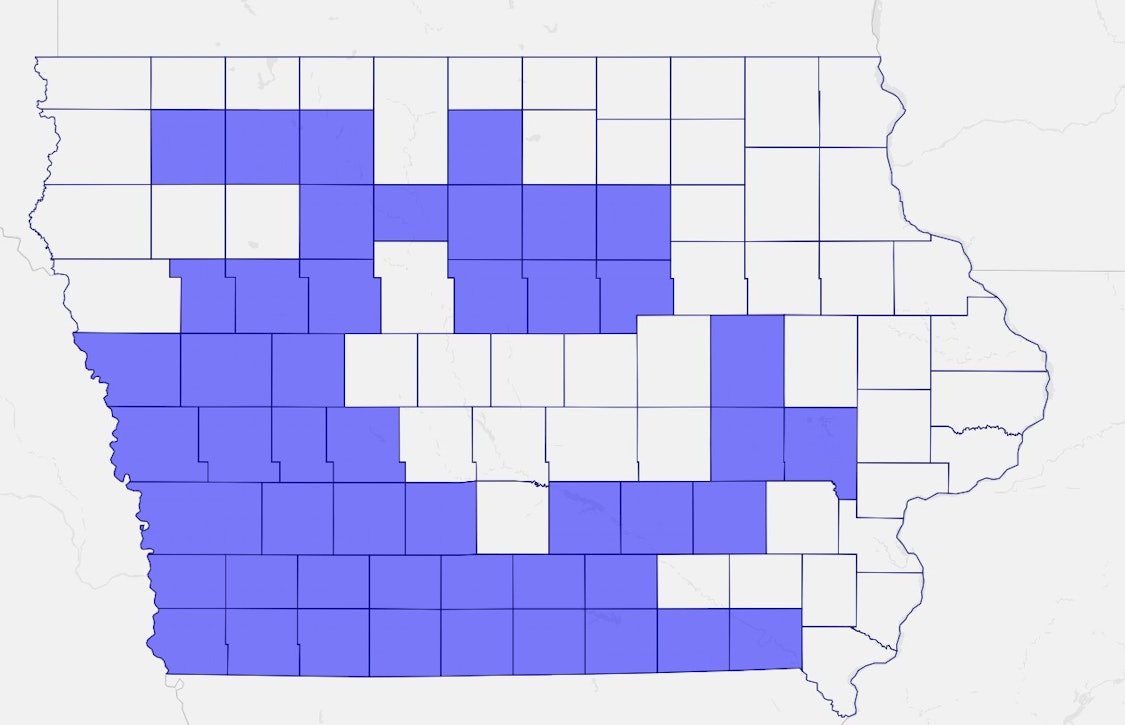
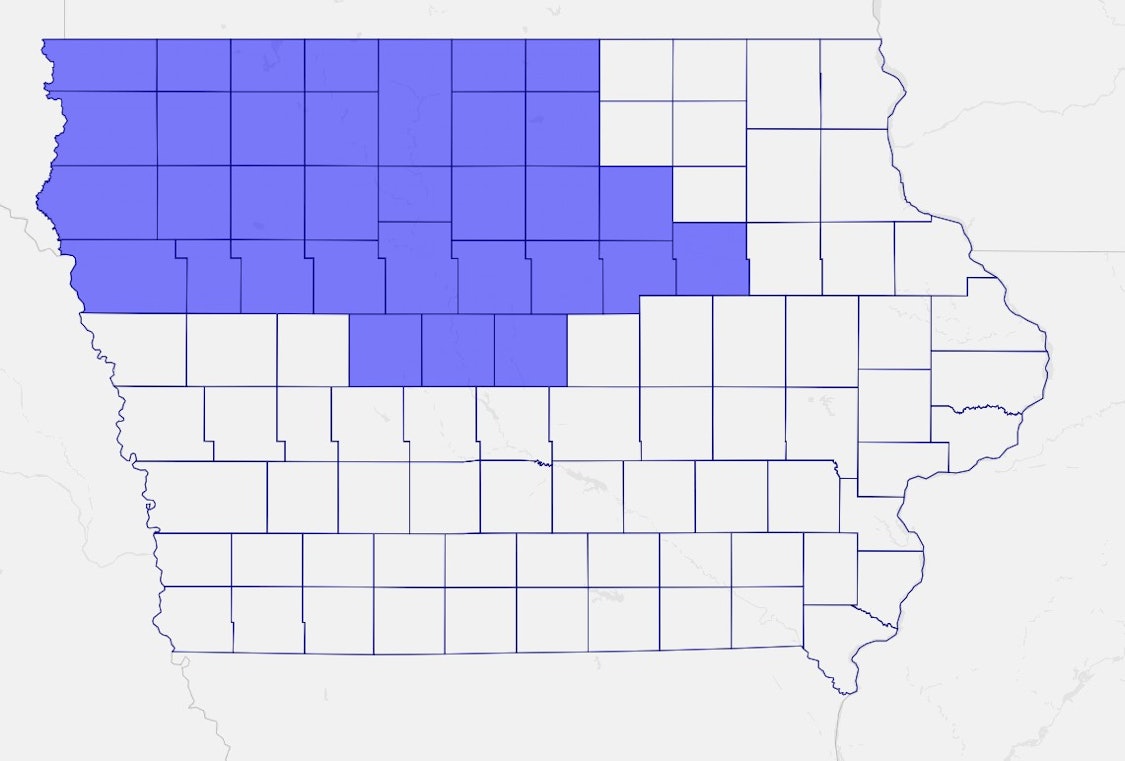
3B: SOLO-Woodbury-Pottawattamie
Population: 797,955
Variance from ideal: 0.05 percent
Minimum OPRV: 0.06 percent
Meets statutory standard: YES
Meets judicial standard: YES
Meets LSA standard: NO
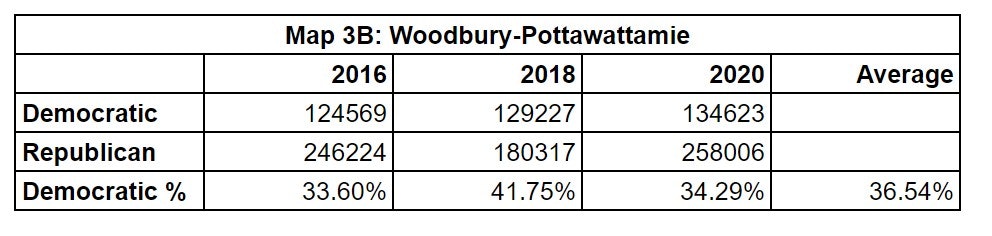
On the other end of the spectrum, you can draw a district that’s even redder than the current IA-04. This map, or one like it that contained both the northwest and southwest corners of the state, would be very good for Democrats, since it would “pack” even more wasted Republican votes into the fourth district. Interestingly, this map is very close to scoring within the LSA standard.
3C: SOLO-Story-Black Hawk
Population: 798,772
Variance from ideal: 0.15 percent
Minimum OPRV: 0.20 percent
Meets statutory standard: YES
Meets judicial standard: YES
Meets LSA standard: NO
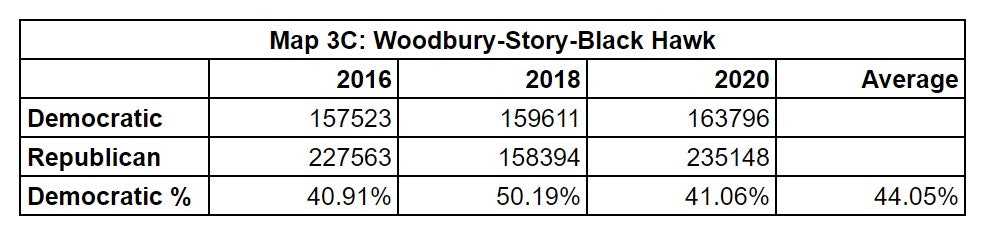
If I were legislative Republicans, I would be interested in a SOLO district that landed in between 3A and 3B. 3A dilutes the power of northwest Iowa by including Polk and Story, and 3B wastes even more Republican votes on an already safe seat than the current map does. Instead, I would want to make IA-04 marginally bluer – just enough to take some Democratic votes off the map for the other districts, while still remaining safely red. Map 3C accomplishes that goal nicely.
Northwest Iowa summary
Since the SOLO block is much smaller than Polk or Johnson Counties, it has a much wider range of possible districts. But this is where I predict Republican leadership is most interested in making changes, so that some R votes in the current CD4 are moved into other, more competitive districts.
Conclusion
This analysis is just the tip of the iceberg. Now that we have census data, we can do other sorts of analysis, such as building out full maps based on the individual districts described above, doing compactness comparisons of possible districts, and doing similar analysis for legislative districts. Stay tuned for more here, as well as updates on the redistricting process as it plays out!
No Comments