Evan Burger speculates on how statutory requirements for drawing new Iowa House and Senate districts could impact partisan control of the legislature during the 2020s. -promoted by Laura Belin
Last month, I wrote about the rules governing Iowa’s Congressional redistricting process, and made some predictions. For this post, I’ll do the same for the legislative side of redistricting – but first, a quick mention of two related developments since my last piece.
On the timeline front, Iowa Capital Dispatch reported that Republican legislative leaders are “working with the federal delegation to learn more about whether census data may come out sooner than expected,” and “Democratic leaders… hoped the data would come out with enough time for legislators to consider the maps.”
It is highly unlikely that the Census Bureau will rush their process in order to release counts in time for Iowa’s September 15 deadline, and rightfully so. These numbers will determine political representation in the state for the next ten years, so it’s crucial that the Census Bureau takes the time to get them right. Rather than the non-strategy of asking for a better timeline, legislative leadership should ask the Iowa Supreme Court to clarify how they intend to handle the delay. (Zach Montellaro has a good rundown of how other states are handling the delays here.)
Second, the Temporary Redistricting Advisory Commission (TRAC) held its first meeting on February 22 and its second meeting today. TRAC is made up of five members: Republicans appoint two, Democrats appoint two, and then those four members elect a fifth. This year, the Democratic appointees are Deidre DeJear, the party’s 2018 nominee for secretary of state, and Ian Russell, an attorney in Davenport. Republicans nominated Dave Roederer, the recently retired director of the Iowa Department of Management, and former Iowa House Majority Leader Chris Hagenow.
The four members so far are in the process of reviewing candidates for the fifth position, and plan to reconvene on Monday, March 8 to elect someone to fill that position. Hagenow and Roederer have put forward Carmine Boal, a former state representative and Iowa House chief clerk, while DeJear suggested Terese Grant, president of the League of Women Voters of Iowa, and Jazmin Newton-Butt, the president of the Quad Cities LULAC. Since the commission already has three male members, the fifth must be a woman.
In normal cycles, the primary job of the committee is to organize public hearings on the Legislative Services Agency’s proposed maps. However, in light of census delays, TRAC may take on a larger role this cycle. If nothing else, the TRAC meetings will give the public a chance to hear LSA’s latest news on how to handle the delays.
For example, at today’s meeting, Ed Cook at the LSA raised the possibility of separating legislative redistricting from Congressional redistricting. Generally, the LSA draws Congressional districts first, then draws legislative districts within those Congressional districts. Cook suggested that the two could be decoupled this year, to allow a legislative map to be approved in time for a state constitutional deadline that doesn’t apply to Congressional redistricting. This would be a radical departure from past practice, and is a great example of why an Iowa Supreme Court opinion on how to handle the delays would be so helpful.
So the timeline of redistricting is still uncertain, and the Iowa Supreme Court may take the process out of the hands of the legislature. But so far, there have been no attempts to change the constitutional and statutory requirements that govern redistricting, which allows us to make some predictions about how the new districts will impact partisan control of the legislature.
Legislative redistricting rules
The requirements governing legislative redistricting are similar but not identical to the rules governing Congressional redistricting. Like Congressional redistricting, the principles of equal population and contiguity are paramount; all House districts must be contiguous and as close as possible to the same population; the same applies for Senate districts.
Article III, Section 34 of the Iowa constitution also requires that legislative districts be as compact as possible. Chapter 42 of the Iowa Code specifies that this should be measured using the same two standards of compactness as Congressional districts. The perimeter measure of compactness states that districts with shorter perimeters are more compact, while the length-width measure states that districts with the smallest difference between their length and their width are most compact. Just as with Congressional districts, compactness is a secondary consideration when judging maps; equal population and contiguity are more important.
However, legislative redistricting also differs from Congressional redistricting in several key ways. Most importantly, the requirement that Congressional districts be made up of whole counties does not apply, since many counties are large enough to contain multiple House and Senate districts. In practice, legislative districts are made up of whole precincts instead of whole counties.
Another difference is that legislative districts should attempt to follow political boundaries:
To the extent consistent with subsection 1, district boundaries shall coincide with the boundaries of political subdivisions of the state. The number of counties and cities divided among more than one district shall be as small as possible. When there is a choice between dividing local political subdivisions, the more populous subdivisions shall be divided before the less populous, but this statement does not apply to a legislative district boundary drawn along a county line which passes through a city that lies in more than one county. (Iowa Code Chapter 42.4, subsection 2)
In other words, as few cities will be split as possible, and when splitting is necessary, larger cities will be split first. Much like the compactness standard, following political boundaries is a secondary consideration after equal population and contiguity.
One final statutory standard is that House districts should be “nested” within Senate districts, and Senate districts should be nested within Congressional districts, as far as possible. With four Congressional districts, each Congressional district would have 25 House districts and 12.5 Senate districts – meaning that two Senate districts would have to span across Congressional district lines. As noted above, Ed Cook at the LSA floated the idea that this standard could be superseded in favor of letting the Supreme Court draw legislative boundaries separately from LSA drawing Congressional boundaries.
Taken together, these rules do a good job of protecting against gerrymandering. First and foremost, the standard of following political boundaries protects against the gerrymandering tactic known as “cracking”: the practice of splitting up a population with the goal of diluting its political influence.
To show how cracking works, and how the Iowa process prevents it, let’s look at a blue city like Ames. In a state without a standard of following political boundaries, a city like Ames could be split among numerous House districts, where each district has enough rural voters to outweigh the more liberal Ames voters.
But in Iowa, the standard of following political boundaries produces maps like the current House Districts 45 and 46:

In 2010, Ames was not quite big enough for two House districts on its own. But the boundary of House District 45 follows the boundary of Ames, and then a few rural precincts are added to the rest of the city to make up House District 46. This results in more fair representation than if Ames were split up without regard to political boundaries.
The legislative redistricting rules make Iowa’s districts more fair, but they also make the kind of predictions that I made for Congressional districts more challenging. No single precinct is large enough to meaningfully limit the other precincts it could be grouped with; compare that to Congressional redistricting, where there are only so many possible districts that include Polk County. And precinct-level population estimates are also not accurate enough to draw many conclusions in between censuses.
So for this article, I will use a different method to draw conclusions about possible redistricting outcomes, built on city-level population estimates and historic performance of each party in different kinds of districts.
This method is possible because we do have good population estimates at the city level, from the Census Bureau’s annual Population Estimates Program. In 2019, the bureau estimated that Iowa’s statewide population was around 3,150,000. Based on that we know that the ideal House district population will be around 31,500 people and the ideal Senate population around 63,000 people.
Thanks to the PEP dataset and the standard of following political boundaries, we can predict how legislative districts will be distributed on a rural-urban spectrum. And since we know how each party fares in urban areas vs rural areas, this distribution allows us to calculate the likelihood of different paths to a Democratic majority in each chamber, starting with the House.
House predictions
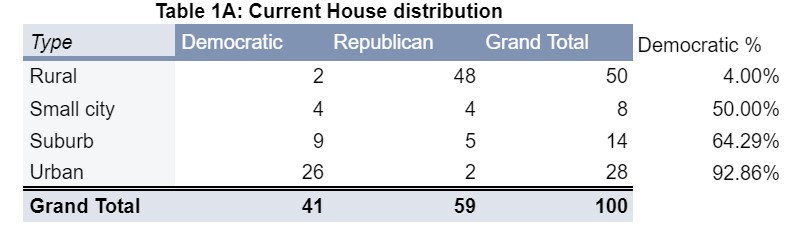
Democrats currently hold 41 of the 100 seats in the House. The districts represented by these 41 seats are predominantly urban and suburban, as shown here:
I’ve defined districts by where most of the votes in that district are cast:
Urban: Most of the voters live in a city with a 2019 estimated population of 31,500 or more
Small city: Most of the voters live in a city with a 2019 estimated population greater than 15,750 but less than 31,500, that does not share a border with a larger city
Suburb: Most of the voters live in a city with a 2019 estimated population greater than 15,750 that shares a border with a larger city
Rural: Most of the voters live live in unincorporated areas or in cities with a 2019 estimated population less than 15,750
Note: You can find a categorization of every city and district in Iowa, along with other datasets I reference in this article, in this spreadsheet.
I used the thresholds of 31,500 and 15,750 because those correspond to a full House district and half a House district, respectively. A city of 31,500 or more has enough voters to make up at least one House district. A city of 15,750 does not have enough voters to make up a full House district, but it does have enough voters to make up the majority of whatever House district it is included in.
Table 1A shows what every political observer in Iowa already knows: that Democrats are currently dominant in urban districts, have an advantage in suburban districts, evenly split small city districts, and do terribly in rural districts. But every political observer also knows that the rural population is shrinking while the suburban and urban population is growing, so let’s look at how many new urban and suburban districts we can expect to result from redistricting.
When thinking about how to calculate this, let’s refer back to the standard that legislative districts must respect political boundaries, and the example of Ames. Ames has a 2019 estimated population of 66,258. Since the ideal House district population is 31,500, the population of Ames is equivalent to a little more than two House districts. Since districts attempt to respect political boundaries, we know that the 66,258 residents of Ames will not be distributed across many more than two House districts – which means that their political power will not be diluted too far, nor will it be used to dominate too many districts.
Specifically, if we look back at how many current districts an urban city has, we see that the fewest districts an urban city can have is calculated by its population divided by the ideal district population, rounded to the nearest whole number. And the most districts an urban city can have is that minimum plus one.
Small cities are a slightly different situation. By definition, they are large enough to dominate only a single House district. And since small cities are geographically spread out across the state, we know that each city in this category can have one and only one House district.
For suburbs larger than 31,500, the urban formula applies, while for suburbs between 31,500 and 15,750 population, the small city principle applies.
And finally, no rural city is large enough to dominate a district.
We can test this method by applying it to 2010 Census data, and seeing how it compares with the actual number of districts each city has. The “Cities by HD” tab of the reference spreadsheet shows that the actual number of districts in each city does fall in the range produced by the method. If we apply the formula described above to 2019 population estimates, we can determine how many districts each city will receive this time.
Here are the totals, if we take the maximums for urban and suburban districts:

In this case, the current partisan breakdown is enough to push Democrats into the majority. In other words, if by some miracle, a map that maximized the representation of urban and suburban areas was approved, the current party coalition is enough to win control of the House. Now let’s look at the other end of the spectrum, where we sum up the minimum number of districts for every urban and suburban city:

So if the Republicans manage to manipulate the process enough, and the worst-case scenario comes to pass, urban and suburban areas could actually lose representation, despite growing much faster than the state as a whole over the last decade.
Both the best case and the worst case scenarios are highly unlikely. They represent the opposite ends of possibility, but each would require a very specific set of census results, and would be vulnerable to court challenges that they are stretching the limits of the “respecting political boundaries” standard.
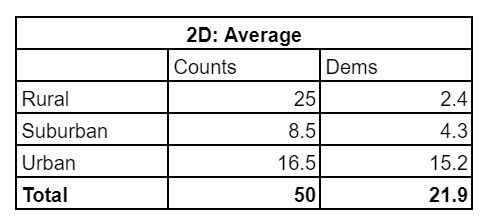
But these limit cases are helpful because we know that the actual result will fall somewhere in the middle. Here are the results if you average the best-case and worst-case scenarios:

So suburban areas are likely to pick up something like three House districts and urban areas either three or four, all of which come at the expense of rural areas. If Democrats continue their current trend of victories, they can expect to pick up two of the new suburban seats and three of the new urban seats, bringing them to 46 seats.
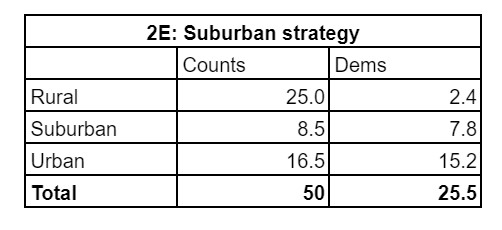
That’s an improvement, but 46 is not yet a majority. Democrats would still have to improve their numbers in one of these categories. The current strategy seems to be focused on suburbs, so let’s see what happens if Democrats win the same proportion of suburban seats as they currently do urban seats:

That leads to a slim majority. Another alternative would be to focus on improving our abysmal showing in rural areas. Here’s the distribution of seats if Democrats go from winning 4 percent of rural seats to 14 percent, and from 50 percent of small cities to 60 percent.

So there are several possible paths to a House majority: either hope for a ridiculously good map, make the suburbs as blue as the big cities, or do slightly better in rural areas and small cities. But the House is only one of two legislative chambers, so let’s now turn to the Senate.
Senate
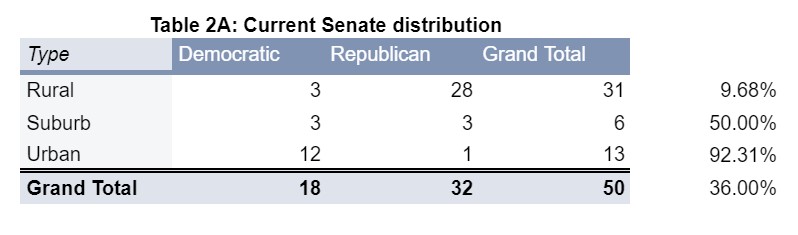
If we apply the same district type definitions as above to the Senate, we come up with this distribution:
One obvious change from the House table is that no Senate districts are dominated by small cities. This is because small cities, by definition, are too small to dominate a Senate district. They must be lumped in with other areas to make up a full Senate district. This is one reason that Democrats are doing worse in the Senate than the House: the Democratic votes in small cities like Muscatine, Burlington, Marshalltown, or Clinton are outweighed by the rural voters in the rest of their respective Senate districts.
The formula to calculate predicted Senate districts is also different because of their larger size. For cities with a population over 63,000, the minimum is their population divided by 63,000, rounded to the nearest whole number; for these cities the maximum number of districts is one greater. For cities between 31,500 and 63,000, they will each have one Senate district, and cities smaller than 31,500 will have none.
We also have to adjust the predicted number of suburban districts to account for three clusters of suburbs in central Iowa: Altoona, Pleasant Hill, and Bondurant; Johnston and Grimes; and Clive and Waukee. None of these seven cities are large enough to dominate a Senate district, but if they are districted with their neighboring small suburb, the resulting district would be suburban.
So if we sum up the maximums produced by my formula, and add three additional suburban districts to account for the central Iowa situation, we get:

Much like the House, new districts that maximized the amount of urban and suburban representation would lead to a Democratic majority with the current party coalition. The worst-case scenario produced by the method is not quite so rosy:
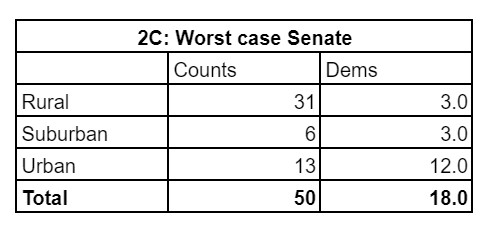
One note on these worst-case numbers: my prediction method, applied to 2010 census data, accurately predicts the number of Senate districts for all cities except for Davenport. Davenport’s population meant that it should have had two Senate districts, but instead it only has one that it definitively dominates (Senate district 45). The rest of its population is split between Senate district 46, where the urban population is outweighed by rural voters, and Senate district 47, where it is outweighed by suburban voters.
This situation, although it arose through Iowa’s nonpartisan redistricting process, is a good example of the cracking technique I mentioned earlier. In our current process, Davenport’s underrepresentation is an anomaly – if the standard of respecting political boundaries were removed from code, it would become the norm. If you want to account for situations like Davenport as a flaw in my prediction method, rather than an anomaly in Iowa’s process, you could revise the number of urban and suburban districts in Table 2C downward. But for my purposes, I’ll use Table 2C as one end of the spectrum, and Table 2B as the other. If you average them together, you get:
Again, like the House, an improvement, but not a majority. And again, like the House, a suburban strategy requires Democrats to win suburban seats at the same rate as they currently win urban seats:
Finally, a rural strategy that results in Democrats winning 24.68 percent of rural districts instead of 9.68 percent leads to a majority as well. And while 25 percent seems like a lot of rural districts, in absolute numbers that’s only four seats – and “rural” Senate districts include places like Marshalltown, Muscatine, and Burlington.

Conclusion
The numbers above show that redistricting alone won’t result in Democratic majorities. Unless Republicans somehow allow urban and suburban areas to be over-represented, or the suburbs of Iowa become as blue as the cities, the path to legislative majorities runs through rural areas. The current Democratic coalition is able to win at the national level, and it even wins some Congressional seats here in Iowa, but it is not enough to win even one branch of state government.
In my last article, I mentioned that winning rural areas will require Democrats to both improve their rural platform, and to change the way we organize. I would like to add a bit more context about what I have in mind.
The conventional way campaigns do policy and organizing is based on hiring a polling firm to test various messages with different groups of voters. Most of your budget is spent on paid media (i.e., ads) that push those messages. A much smaller portion of your budget is used to hire organizers who reinforce those same messages at the doors and on the phones. All of this happens in the run-up to the election, and since it’s driven by campaigns rather than by the state party, it all disappears the day after the election.
This model of campaigning might have helped Democrats pick up suburban seats, but it is not working in rural Iowa. The conventional model of organizing resembles what George Goehl calls “mobilization” in his recent article Organizing New People by Listening. Goehl contrasts mobilization with the old-fashioned model of community organizing, where policy and organizing go hand-in-hand. In that model, organizers embed themselves in a local community, discover hot local issues, and then connect those local issues to bigger issues.
I can say from personal experience that this kind of organizing is much harder work than the mobilization role that organizing plays in a conventional campaign. Doing this hard work would take the political courage to try something new, the patience to do the work over several campaign cycles, and the resources to do it effectively. But I believe that work is all worth it if, as the analysis above shows, reprioritizing rural areas is our only hope of breaking the current Republican trifecta.
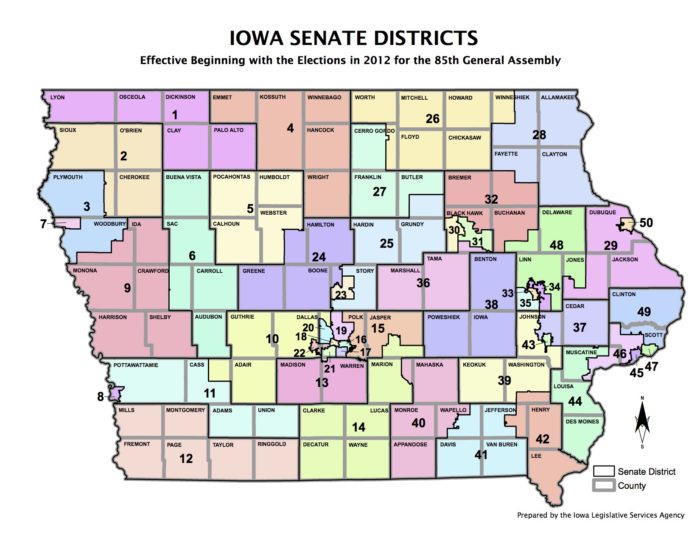
Top image: Map of Iowa Senate districts adopted in 2011.
1 Comment
Thank you, Evan Burger, for this careful detailed analysis...
…which didn’t exactly make my day in terms of political cheer, but is a needed view of where we really are. We Democrats need to fully face our reality before we can change it. And our reality is that Iowa is bright red and will stay bright red unless/until we can figure out how to swing some rural districts.
PrairieFan Tue 2 Mar 2:15 PM