
Jon Muller examines factors contributing to Iowa’s budget crunch. What do you want first: the bad news or the “quite disturbing” news? -promoted by desmoinesdem
The Iowa Revenue Estimating Conference (REC) reduced its FY 2017 estimate for General Fund Revenues by $106 million. That’s on top of the $96 million downward revision in December 2016. Since the original estimate used for FY 2017 appropriations (December 2015), cumulative downward revisions total $243 million on a $7.3 billion budget.
This has led to all the gnashing of teeth that comes every time revenues begin to slow. The REC has never been particularly prescient when it comes to predicting the turn in receipts, either on the way down or the way up. I have some insight into this phenomenon because I used to be a revenue estimator for the Iowa General Assembly, and wasn’t any better than they are now. Indeed, economic models in general are not very good at predicting turns in the business cycle until after they happen. They are very good at generating consensus forecasts that tend to magically predict the next year will look a lot like the current year, at least during stable periods.
What’s new this time around is, according to policy makers expressing concern about the downgrade, is the reduction in revenues during what is considered a reasonably healthy economy. In my view, the stress on the General Fund is actually due to two primary factors. The economy is perhaps not quite as robust as consensus opinion suggests. Secondly, it appears the cost of House File 2433 passed during the 2016 legislative session, a bill providing a sales tax exemption for items consumed in manufacturing processes, was dramatically understated.
I suspect those looking to blame the sluggishness on a downturn in the farm sector will be disappointed as farm income growth begins to turn positive. Those who believed hundreds of millions of dollars of tax cuts and credits would spur state revenue growth should be equally disappointed. It’s just not happening.
Economic Outlook
There is a general misconception that the Iowa economy is humming along at a healthy, albeit measured pace. The Unemployment Rate is likely more responsible for this view than any other economic indicator, and understandably so.

Unfortunately, the “unemployment rate” doesn’t buy stuff. Employed people do. And therein lies the problem. Employment essentially peaked in the last quarter of 2014. It is very challenging to achieve significant revenue growth in a period of stagnant employment growth.

You may have already reconciled the divergence between the two previous charts, and it is quite disturbing. The Unemployment Rate is defined as the Number of Unemployed / Total Labor Force. And the trend is not our friend. While total employment is almost identical to its peak in 2014, the labor force appears to have already made the turn, with 12,000 fewer people in the workforce than the peak.

Given that consumption and personal income taxes are 87 percent of gross receipts, a period of softness is no surprise given these trends (note: there has been a disturbing trend of shifting revenues out of the General Fund over the past 20 years, effectively raising this percentage, a discussion for another time). The only way out of the tunnel is if Personal Income is growing, either from inflation or real growth.
Unfortunately, things are getting worse on that front as well. The following chart shows withholding receipts over the past 10 years, annualized over the twelve trailing months. The last two entries are January and February 2017. Receipts appear to have peaked, and a subsequent decline may be under way.

If we take each monthly entry, and compare to a year earlier, the impact is a little easier to see. The following chart compares withholding receipts for the past twelve months the 12 month period ending one year ago. For example, the last point shows that withholding receipts for the 12 months ending February 2017 were 2.8 percent higher than the 12 months ending February 2016.

Withholding receipts are highly correlated with, and a good predictor of, total personal income for the State of Iowa. Over the past 44 quarters, the variance in annualized withholding is 96 percent correlated with annualized personal income.

In defense of the REC, while it is reasonable to wonder why the December estimate was not ratcheted down more than it was, it’s important to emphasize how recently and dramatically withholding receipts started to decline. Revenue for the 6 months ending December 31, 2016, was holding up relatively well at 4.4 percent growth. To achieve the 5.8 percent growth targeted in the December REC report would have been difficult without some acceleration, either in wages or employment, neither of which was in play. But the situation really started to turn in January and February of this year. Those two months are 2.5 percent less than the same two months a year ago. Adjusted for the extra day in February last year, the reduction is closer to 0.8 percent, which is still a stark departure from the established trend.
With fewer unemployed available for job openings, flat employment levels, evidence of decelerating wage growth, it is difficult to conclude the revenue picture is going to get better before it gets worse.
Sales Tax Challenges
While withholding receipts are still 2.5 percent higher, fiscal year to date, Sales and Use tax revenues are flat, up less than two-tenths of a percent. The REC reduced the FY 2017 estimate from 1.9 percent growth to 1.5 percent growth. This implies the underlying economic drivers for sales tax revenue were expected to reach 3.0 percent for the December estimate, and 2.6 percent in the March estimate.
These numbers are based on a reduction in sales tax caused by House File 2433 during the 2016 legislative session. One year ago, the Iowa Department of Revenue estimated a sales tax exemption for purchases of various inputs consumed in the manufacturing process. The Department estimated an impact of $29.2 million for FY 2017, including both State General Fund, school infrastructure, and local option taxes. That estimate appears to be a little light, as both Sales and Use taxes are anemic beyond what would have been expected from the law change and the economic climate.
At the time the estimate was prepared, there was no breakout between Sales Taxes and Use Taxes. Sales taxes are paid by corporations when they purchase a taxable item within the State of Iowa. When the items are purchased outside of the State of Iowa, corporations are required to submit Use Tax, as tax is owed where the item is used, not where it was purchased.
We should expect that Use Tax is more adversely impacted than Sales Tax, on a proportional basis. Very little Use Tax is remitted by consumers. It is predominantly a business tax. But we do have data going back to 2004, which covers both the Great Recession and the subsequent expansion. Starting there, we can begin to estimate the impact of the sales tax exemption for manufacturers.
For the current fiscal year through February 2017, Use Tax receipts are down 4.1 percent, or approximately $15.3 million compared to the same period a year ago. Let’s put that in context with what’s going on with the rest of the economy. As discussed earlier, the economy does not appear to be expanding sufficiently to drive high rates of sales tax growth, but there’s nothing to suggest it should be less than 2.5 percent. Employment has not actually declined, nor have wages.
As employment has held relatively steady, we should expect at least an inflationary level of growth in the Use tax revenues, along the lines of FY 2016’s 1.9 percent growth rate. Applying that baseline rate to last year’s level suggests total FY 2017 Use Tax revenues of $519 million. If the current trend, down 4.1 percent, continues through the end of the year, we should expect $488 million, a reduction of $31 million. That’s almost spot on the estimate provided by the Department of Revenue (and used by REC) to adjust the total Sales/Use tax lines.
On the other hand, while employment is relatively stable, this is really a shocking reduction in Use tax receipts through February, with annualized declines worse than the low point that trailed the Great Recession (though not as low as the most months in 2009, which are distorted by the implementation of the statewide school infrastructure penny). We either have to believe that the economy is really heading lower (to the extent Use tax receipts reflect the economic cycle), or the impact of the manufacturing Sales/Use tax exemption is much worse than forecast.

While businesses pay the lion’s share of Use tax, and while the impact of the Use tax exemption disproportionately impacts Use tax, it may still be true that the majority of the Sales/Use combined impact is actually revealed in the sales tax line. This can be measured by the Regional Purchase Coefficient (RPC) for these industries. If an industry purchases its inputs 65 percent in state and 35 percent out of state, that would be an RPC of 0.65. The lowest RPC by industrial classification belongs to the Wholesale Trade Sector, which supplies (a) goods for resale, (b) capital or durable non-consumer goods, and (c) raw and intermediate materials and supplies used in production. I would expect the lion’s share of items exempted by the sales tax to fall into this very broad category. Dave Swenson, an economist at Iowa State University, provided an estimate for me, suggesting an RPC for this group at 0.67, meaning 67 percent of the inputs are purchased in state and would have been subject to the Sales tax. The other 33 percent would be purchased from out of state, and subject to the Use tax.
We can take the low end of the Use tax exemption estimate of $31 million, and divide by .33 to arrive at a total impact of $94 million.
By way of a different approach, the same methodology to estimate Use tax impacts can be applied to the Sales tax. As the impact is smaller relative to the overall revenue source, it is more difficult to parse out. Regardless, it’s worth reviewing.
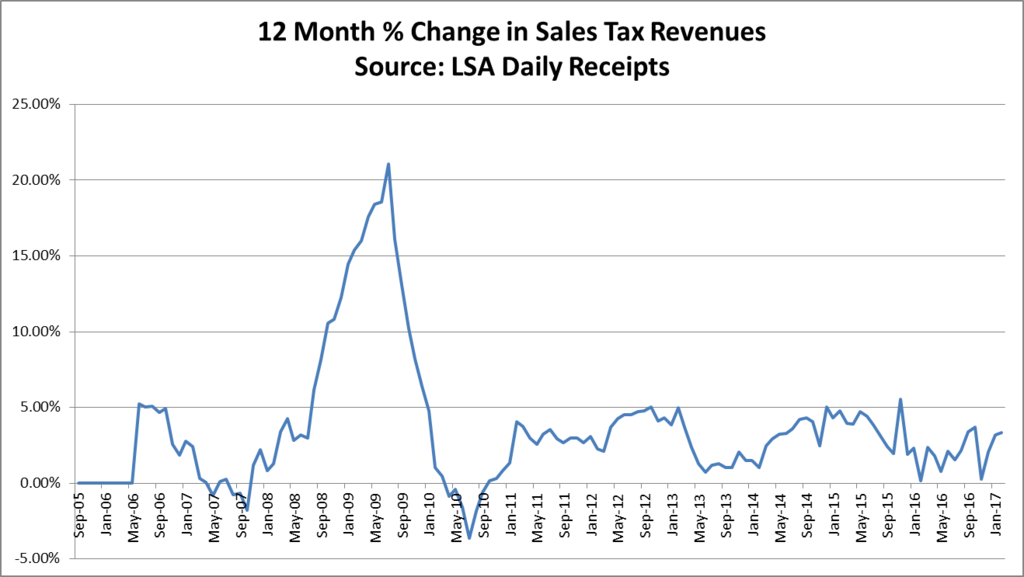
On a trailing twelve month basis, Sales tax revenues appear to be holding up much better than Use tax revenues. Also worth noting the spike in FY 2009, which is due to the statewide school infrastructure penny. That year would have been quite anemic otherwise. But it does amplify how much more Use tax revenues are impacted by the business cycle than are Sales taxes. Still in all, 3.4 percent Sales tax revenue growth over the past twelve months is respectable in light of the exemption.
However, the story gets a little more troublesome when we just look at the current fiscal year through February. Sales taxes in the first eight months are running at just 1.2 percent ahead of the same period a year ago. Again, assuming a continuation of this trend, compared to last year’s growth of 2.5 percent, we can imagine a loss due to the Sales tax exemption of about $22 million, which is considerably less than the $63 million Sales tax estimate provided above. Perhaps this approach should be thought of as a lower bound of $53 million total impact from the tax, which would be a sizable miss, to be sure.
There is one bit of hope with respect to the continuation of the trend toward lower Use tax collections for the remainder of the year. We observed a reduction in collections in Use Tax starting in April 2016, the first month after the bill passed. While retailers and wholesalers would surely have continued to collect the Sales tax until the law went into effect on July 1, 2016, is it possible that businesses responsible for self-reporting the out-of-state purchases decided to change behavior as soon as the Governor signed the bill? What are the chances the Department of Revenue would expend much in the way of resources to audit a tax that was going away in a few months? If this is the case, it would not change the analysis with respect to the overall annual impact of $50 million to $100 million. But it might mean that some of the cost of the Use tax exemption was realized in FY 2016, and the impact going forward will be mitigated on a year-over-year basis. If we start to observe a rebound in Use tax receipts in April through the end of the fiscal year, this factor might well explain it.
Farm Income Impacts
Farm income is indeed below its peak quarter, which according to the Bureau of Economic Analysis, reached $8.6 billion on an annualized basis in the 4th quarter of 2013. Deviation in farm income is a frequent and convenient scapegoat for what happens with Iowa General Fund revenues, but I have never found a serious correlation between the health of the state budget and the state’s farm economy. I do not see any evidence that changes my view today.
There are three primary reasons for this. First, farm income is a much smaller share of statewide personal income than it used to be. Though that relative strength started to stabilize after the 80s farm crisis. Next, farm spending in the economy is not nearly as erratic as net farm income. Lastly, farmers have ways of spreading profit over several years, and current data in Income tax returns data suggests tax payments from farmers have returned to some growth.

As of the second quarter of 2016, on an annualized basis, farm income is about 2.5 percent of total personal income. That is down from 4.0 percent a year earlier, but it is doubtful that this represents a serious issue with respect to revenues overall. And in any case, farm income appears to have stabilized along with commodity prices generally.
Farmers also have tools available to spread the impact of their profits over multiple years. They can do this both by adjusting capital investments, and also statutorily through a process called “income averaging” which isn’t available to non-farmers. So the wild swings in farm income are not really experienced to the same degree in terms of statewide income tax collections.
While Farm income can vary from year to year, and even go negative, farm spending is considerably more stable. According to USDA’s Economic Research Service, for example, from 2012 to 2017 (est), while the ratio of high farm income year to low farm income year varied by 7:1, the ratio of total expenditures (high to low) was just 1.2:1.
And the anecdotal evidence seems to bear fruit in this regard. Based on consultation with farm tax return preparers, we may expect 3/4 of farmers to file their return by March 1. One reason they have an earlier filing deadline is, they can choose not to make any January estimated payments, and there is no penalty for doing so as long as the return is filed by March 1.
We should expect tax payments on returns to be disproportionately farm returns during the post March 1 period. From March 1 through March 20, return payments are running at $75.4 million, which is 47 percent ahead of last year’s level of $51.3 million. It is not clear how many of these are farm returns, of course. But by way of sensitivity testing, farm income does not appear to be a problem. It should also be noted that Refunds during the same period are down considerably this year, but it is very difficult to know how much of that is a function of the speed with which the Department is processing these payments.
Conclusion
With respect to the farm economy, the evidence suggests it is not a major contributing factor to the decline in State revenues. I would caution, to the extent the farm economy improves, that will not likely lead to a recovery in the State’s General Fund revenue picture.
Sales tax reductions, however, are likely persistent and ongoing. Absent a detailed study of Use Tax returns, adjusted for total corporate spending on manufacturing consumables and other items exempted (either intentionally or inadvertently), it will be very difficult to obtain a clear picture of what happened as a result of HF 2433. Ironically, we should hope that the impact of the Sales/Use tax exemption is at the higher end of the stated range of $51 million to $94 million, at least as it pertains to future REC estimate revisions. If the real impact is close to the $29 million identified by the Department of Revenue, then there is a real concern the canary in the coal mine may already have stopped singing, and the recent revenue reductions are symptomatic of something far more structural than a big tax cut for Iowa corporations.
I will also disclose there are so many factors impacting revenues going forward, and this is a very broad brush attempt to examine whether the original Department of Revenue estimate would pass the smell test. In my view, it doesn’t smell particularly good, recognizing my conclusion is based largely on an analysis that could have been carried out on the back of a very large envelope without losing much fidelity.
Lastly, the Sales tax cut discussed in this piece is just one of several hundreds of millions of dollars given to businesses and property owners over the past several years. All cuts and tax credits, including the granddaddy of them all, the commercial property tax cut, were peddled as a way to improve the business climate and create more employment, higher wages, and state revenue growth. It should give one pause to discover what actually happened almost immediately after the taxes were cut. Public schools are short-changed. Universities are cutting scholarships and raising tuition. The state’s labor force is shrinking. Employment is static. Wage growth may be decelerating. While these outcomes don’t themselves prove the folly of the tax cuts, they are certainly not a ringing endorsement of success.
Although tax credits have not been featured in this piece, they have long been a source of sluggish growth, simply because the growth in tax credits has generally outpaced the growth in gross revenue. I haven’t seen any evidence that the credits led to estimate revisions, so much as they will continue to hamper growth in the future if nothing is done. Mike Owen at Iowa Policy Project had a a really good piece on this issue yesterday. These tax credits grew $40 million (20 percent) in 2016. They are expected to grow another $42 million (18 percent) in 2017, before the growth starts to tail off.
For my part, I am anticipating further downward forecast revisions by the REC in each of the next 3 meetings.