Evan Burger continues his series on redistricting with analysis of the newly released proposed congressional map.
This morning, the Legislative Services Agency released their first set of proposed maps, which can be found here. As expected, the LSA released both congressional and legislative maps — for today I’ll focus on the former, with more analysis to come on the legislative front.
By the numbers
As I’ve written here before, the three standards that the LSA considers in producing a map are contiguity, population equality, and compactness. Of the three, contiguity is an absolute standard: a congressional district must be made up of whole counties that are contiguous. The next most important standard is population equality, meaning the LSA tries to make districts as close in population as possible. However, they must also consider the compactness of a given map, both in terms of minimizing the difference between the length and width of each district, and in terms of minimizing the total perimeter length of all districts.
The LSA’s proposed congressional map easily meets the contiguity requirement. Here is how it scores on population equality and the two measures of compactness:
- Lowest Population: District 2 (797,556)
- Highest Population: District 1 (797,655)
- Difference between lowest and highest population: 99
- Total Perimeter Score: 2,772.02 miles
- Average Length-Width Compactness: 34.96 miles
As usual, the LSA did an excellent job balancing population equality with both measures of compactness. There are certainly maps that are more equal, but they all score much worse on both measures of compactness. For instance, here is the winning entry in Dave Wasserman’s Iowa redistricting challenge:
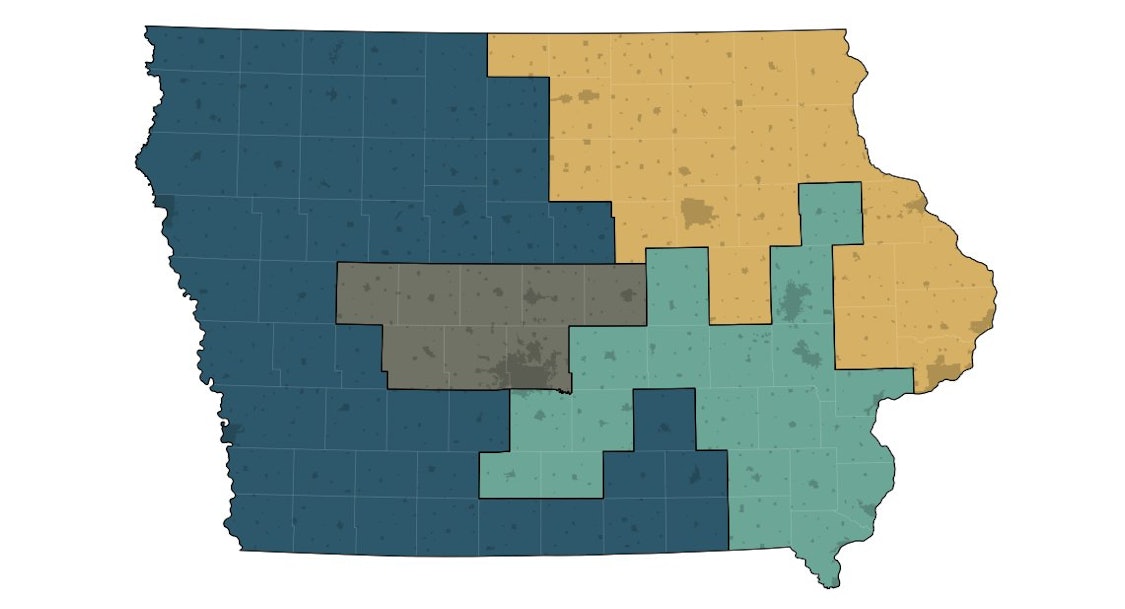
- Difference between lowest and highest population: 5
- Total Perimeter Score: ~3200 miles
- Average Length-Width Compactness: ~40 miles
Similarly, the map that the NRCC supposedly favors does better on perimeter compactness but much worse on population equality.
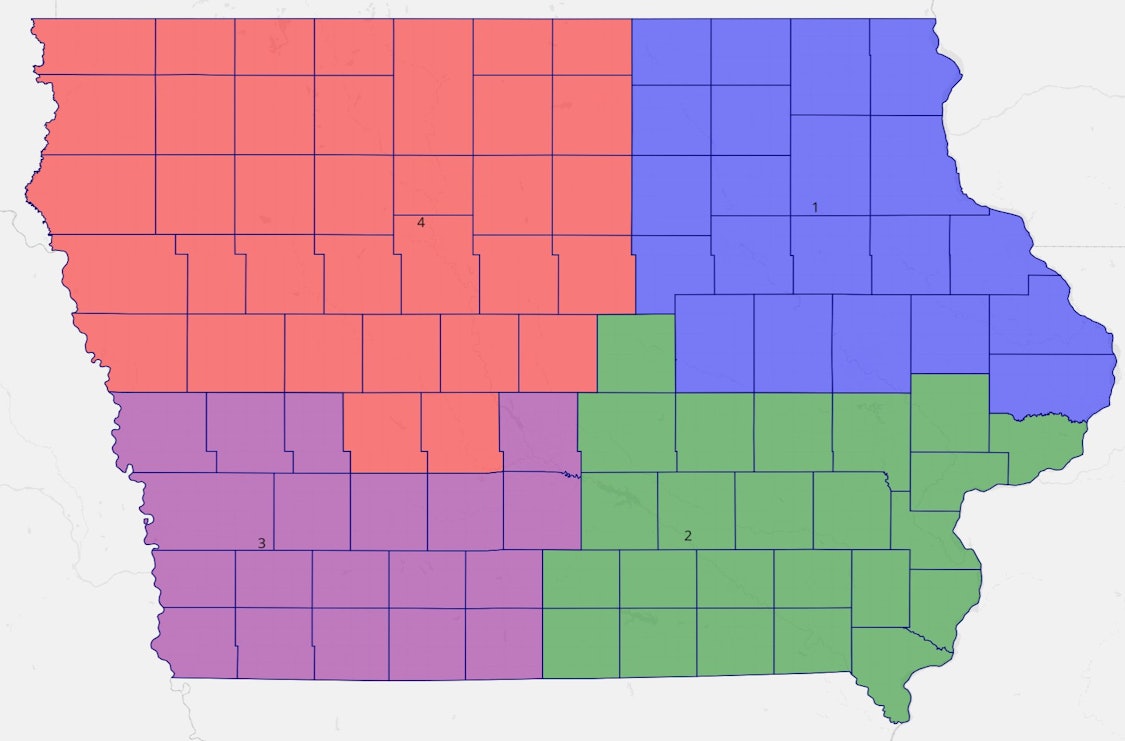
- Difference between lowest and highest population: 1141
- Total Perimeter Score: ~2400 miles
- Average Length-Width Compactness: ~36 miles
As these examples show, it is very difficult to improve on the LSA’s proposed map, because any improvement in population equality tends to result in worse compactness, and vice versa. (As an aside, this tweet from Cory McCartan lists the only other maps that I’ve seen that come even close to the LSA’s proposal.)
Partisanship
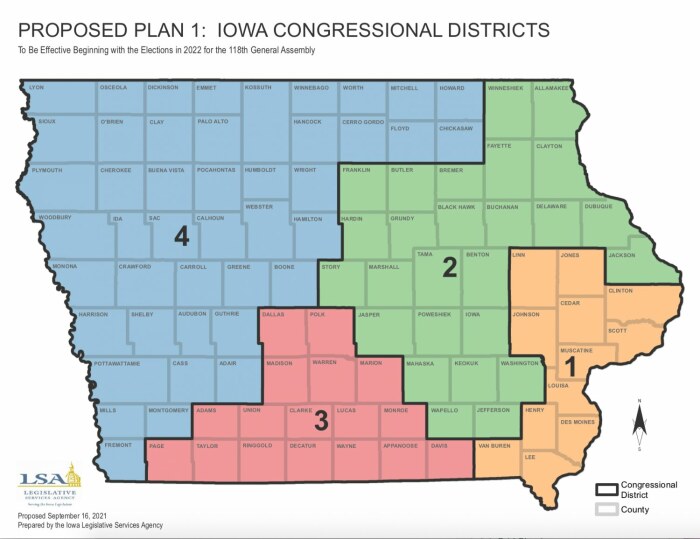
The LSA is not allowed to consider partisanship or past vote results when drafting their maps, but of course the partisan implications of a given map are the reason this process is so important. Iowa’s current congressional map has resulted in three competitive seats (CD1, CD2, and CD3) and one safe Republican seat (CD4). The proposed new map drastically changes that breakdown, mostly because it changes how the ten largest counties are grouped together:
- CD1: Linn, Johnson, and Scott
- CD2: Black Hawk, Story, and Dubuque
- CD3: Polk and Dallas
- CD4: Woodbury and Pottawattamie
By Dave Wasserman’s analysis, the proposed map has one district that went safely for Biden, two districts that went safely for Trump, and one district that was a virtual tie:
- IA01: Biden +8.7
- IA02: Trump +10.8
- IA03: Biden +0.2
- IA04: Trump +31.5
Looking at congressional voting behavior over the last three elections shows similar trends but makes CD2 look more competitive:
- IA01: 56.41%
- IA02: 47.31%
- IA03: 49.34%
- IA04: 38.32%
No matter which measure of partisanship you use, CD1 is safe Democratic, CD4 is safe Republican, CD2 is lean Republican if not safe Republican, and CD3 is a toss-up.
What’s next
The next step in the redistricting process is a public comment period on this first proposal. There will be three public hearings held virtually at the following times:
Monday, September 20: 7:00 – 9:30 p.m.
Tuesday, September 21: Noon – 3:00 p.m.
Wednesday, September 22: 6:00 – 8:30 p.m.
Online comments will also be accepted until the start of the last public hearing. Instructions for submitting public comment will likely be posted here when they are available. All public comments will be compiled into a report that is presented to the legislature when they convene on October 5 to start debate on the proposed maps. (See Laura’s article from Tuesday for more details on the October 5 special session.)
9/16/21 update: public comment instructions can be found here.
This public comment period is a key moment for anyone who cares about redistricting here in Iowa. As I laid out above, the LSA has come up with a very fair congressional map that measures up well against the standards laid out in Iowa Code. Politicians of both parties love to praise the Iowa process — now is the time for them to put their money where their mouth is, and approve the proposed maps.
1 Comment
Very good analysis. But will public comments even be heeded?
I’m really sorry to feel I need to ask that question. I’ve been sending in comments and letters on Iowa public issues for forty years. But in 2021 Iowa, and with time and energy more limited than they used to be, I’m starting to wonder what is and isn’t futile. Which feels like heresy, but there it is.
PrairieFan Fri 17 Sep 7:48 PM