Measuring Size of Obama’s (Relative) Coattails on Congressional Races
This is a long diary to read so I will tell you upfront what my conclusion is after examining the recent SurveyUSA 50-state polling: Yes, Barack Obama may indeed have huge coattails for Senate and Congressional races in the fall. Now, to the long explanation —
The recent SurveyUSA polling indicated a relatively even match between Obama and Clinton re. who would have the most electoral votes when facing McCain. Obama’s total came to 280 EV, while Hillary’s was 276 EV – a seemingly even match:
http://www.surveyusa.com/ECV_5…
http://www.surveyusa.com/ECV_5…
In this diary I have tried to examine whether Obama or Clinton on top of the ticket would be better for us in terms of a “coattail” effect on competitive Senate and House races in 2008 – again based on the SUSA numbers. In that respect, this diary is perhaps not so much about the size of Obama’s coattails on congressional races, as about the RELATIVE size of his coattails versus Hillary’s. In some respects, though, it may be seen not just as a relative thing but as an overall, larger coattail effect — that is if one assumes that Hillary’s performance number is kind of a baseline equal to approximately how Kerry did in 2004. (A number of political analysts have proposed the existence of this so-called “50% plus 1” baseline for Hillary, where they think she may win the general, but only barely, while Obama may have the ability to vastly expand our playing field into previously red territory.)
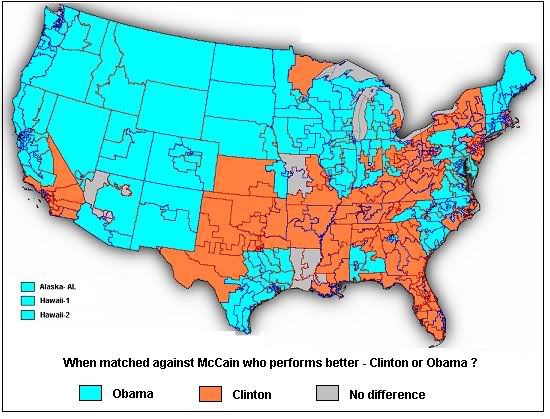
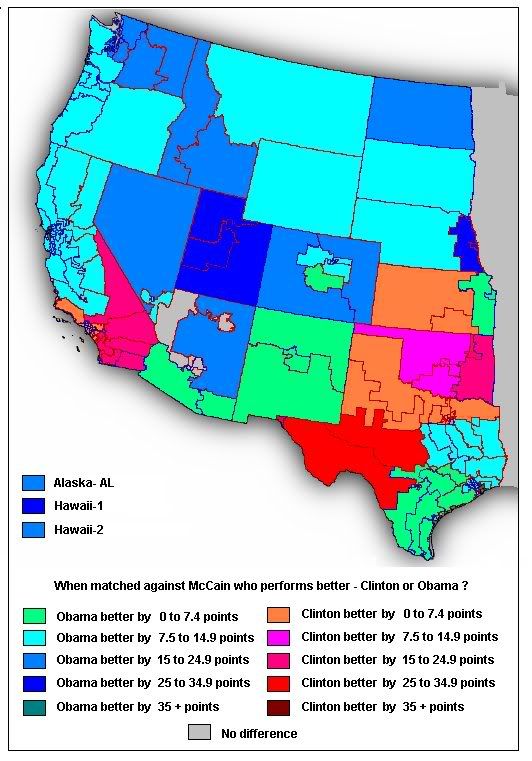
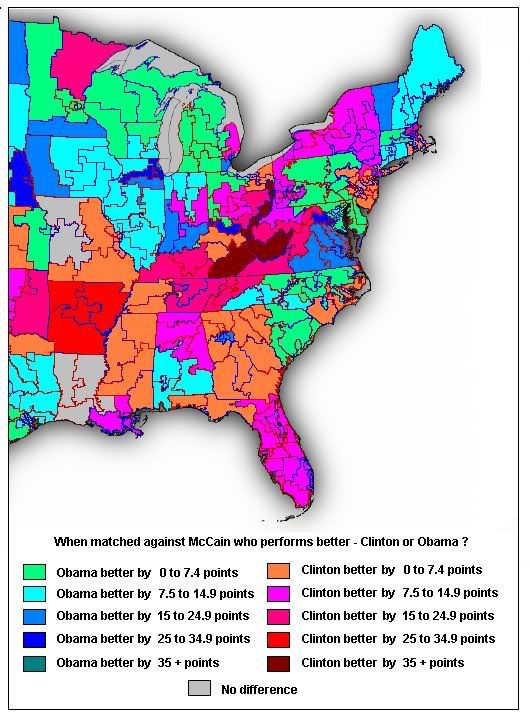
The effect on Senate races is easy to determine, as one just has to look at how Obama and Clinton compare in each state. The effect on House races is more tricky. The SUSA polling provides detailed data in the crosstabs re. how Obama and Clinton perform versus McCain in particular geographical areas of individual states. For some small-population states the only numbers available are state-wide. For most states, however, more detailed data is available by region of each state. In this diary I have tried to correlate the SUSA data with how each of the Democratic candidates performs against McCain by individual (or groups of) congressional districts, and have tried to determine whether Obama or Clinton would be better on top of the ticket by congressional district.
It was not easy to determine the effect on House races, as the SUSA regions do not correlate perfectly with congressional districts or groups of congressional districts. There are many fewer “regions” than congressional districts, and the boundaries obviously do not match perfectly. Nevertheless, I have tried to correlate to the best of my ability, using the data that’s there. Nebraska and Maine were the only states where SUSA actually measured by congressional district as those are the only two states which award electoral votes partly based on district. For other states I have tried to correlate using the regions SUSA provides. The SUSA polling provides what percentage of the state’s entire population is in which region, and in many cases you can therefore rather easily correlate the region to congressional district. For example, looking at data for Minnesota — http://www.surveyusa.com/clien… — you can see that the Twin Cities region forms 57% of the state’s population; south Minnesota is 14%; west Minnesota is 16%; and the northeast area is 13%. In this instance, I have correlated “Twin Cities” with congressional districts 2,3,4,5 and 6; south Minnesota with district 1; west Minnesota with district 7; and northeast with district 8. It’s not a perfect correlation, by any means, but at least it gives us a partial picture of where things are. In many states, the regions and congressional districts seem to overlap, and when correlating I have tried to mathematically account for this. For example, approximately 58% of CA-11 is in the Central Valley region, while 42% is in the Bay Area.
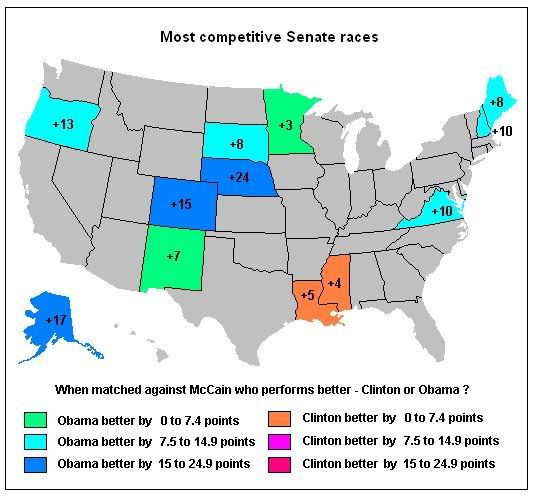
For Senate races I have used the Cook Political Report (Feb. 28, 2008) ranking of states seen as “toss-up”, “lean-Democratic”, “lean-Republican”, “likely Democratic” or “likely Republican” (there are 12 such races):
http://www.cookpolitical.com/r…
Competitive House districts here are ones classified by the latest (March 6, 2008) Cook Political report as “toss-up”, “lean-Democratic” or “lean-Republican”. There are 39 such competitive House races according to Cook. I did not include the “likely Democratic” or “likely Republican” seats in this analysis as, frankly, it was just too much data to deal with in one diary. You may nevertheless correlate info. for any district yourself using SUSA’s cross-tabs and the maps accompanying this diary.
http://www.cookpolitical.com/r…
Out of the 12 states which are likely to have competitive Senate races this fall, Obama performs better than Clinton in matchups against McCain in 10 (Alaska, Colorado, Maine, Minnesota, Nebraska, New Hampshire, New Mexico, Oregon, South Dakota and Virginia) while Hillary does better in 2 (Louisiana and Mississippi).
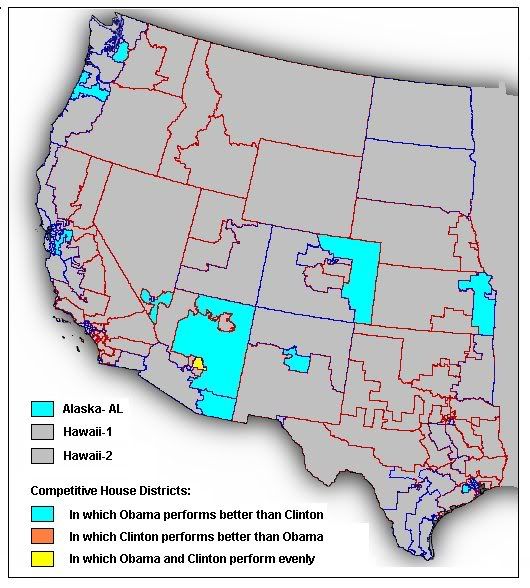
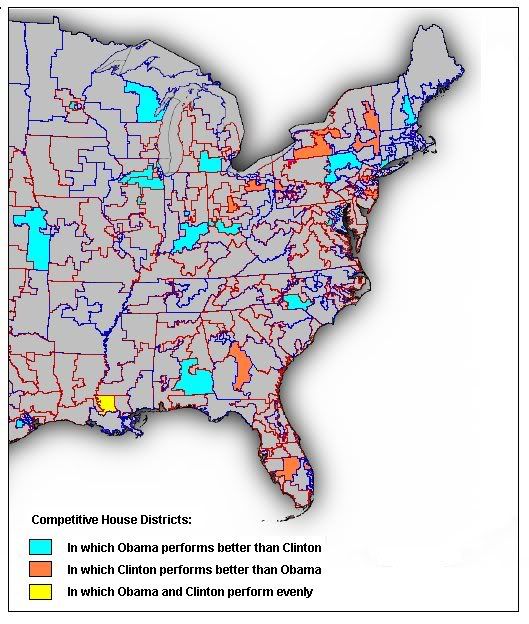
Out of the 39 competitive House races, 27 (69% of total) are ones where Obama performs better than Clinton in matchups against McCain. In 10 (26% of total) Hillary does better, and in 2 House seats both Democrats do equally well.
The maps first, and below them, a listing of the competitive congressional districts:
Congressional Districts:
Competitive districts in which Obama performs better than Clinton (based on SUSA data in parentheses) – total of 27 districts:
I have listed the districts in descending order of their “Obama advantage” number:
OH-1 (Cincinnati area – McCain 42- Obama 54; McCain 55-Clinton 36) – Obama advantage: 31 points
It is interesting to note that OH-1 and OH-2 are two Cincinnati area districts in which Obama seems to have a huge advantage vs. Hillary in terms of performance against McCain. This is in stark contrast to other parts of Ohio, where Hillary has a huge advantage – including an apparent 45 point advantage in southeast Ohio (5% of the state’s population and approximating OH-6 where it’s McCain 56-Obama 31; McCain 36-Clinton 56), which, btw, is the largest advantage for any candidate in all of this polling data. Overall, the disparate numbers from the different corners of the state seem to cancel out each other and whether it’s Obama or Clinton, the Democratic candidate beats McCain 50-40 in Ohio according to the Survey USA numbers.
OH-2 (Cincinnati area – McCain 42- Obama 54; McCain 55-Clinton 36) – Obama advantage: 31 points
IL-14 (Collar Counties – McCain 37-Obama 57; McCain 47-Clinton 34; downstate – McCain 32-Obama 52; McCain 42-Clinton 49) – Obama advantage 33 points in Collar Counties; 13 points in downstate; weighed Obama advantage: 25.4 points
It is perhaps very appropriate that IL-14 is near the top of the list. In the 2006 election Hastert won here 60-40. This past Saturday Foster won here 53-47. Granted, Foster was a great candidate in his own right, Hastert was not running, and Oberweis was a lousy candidate; nevertheless, this was still a very Republican district. In the Almanac of American Politics, Michael Barone described this district as “some of the most heavily Republican territory in the country.” Obama’s ad on behalf of Foster was a big net plus for our side, but even more so, I personally strongly believe that the sheer excitement generated by Obama’s candidacy in Illinois (and throughout the country) may have been the factor which ultimately put Foster over the 50% mark in this district. (I will not analyze the other districts listed, as it would be extremely time consuming in this diary, but I invite the readers to comment with their own analysis of the particular districts listed here in the comments section.)
VA-11 (northeast Virginia – McCain 37-Obama 58; McCain 48-Clinton 42) – Obama advantage: 27 points
CO-4 (“rest of state” – McCain 40-Obama 54; McCain 50-Clinton 40) – Obama advantage: 24 points
AZ-1 (“rest of state” – McCain 45-Obama 41; McCain 57-Clinton 30) – Obama advantage: 23 points
IL-11 (downstate – McCain 32-Obama 52; McCain 42-Clinton 49; Collar Counties – McCain 37-Obama 57; McCain 47-Clinton 34) – Obama advantage 13 points in downstate; 33 points in Collar Counties; weighed Obama advantage: 21.8 points
IL-10 (Suburban Cook – McCain 32-Obama 60; McCain 32-Clinton 51; Collar Counties – McCain 37-Obama 57; McCain 47-Clinton 34) – Obama advantage 9 points in Suburban Cook; 33 points in Collar Counties; weighed Obama advantage: 20.6 points
WA-8 (Metro Seattle – McCain 29-Obama 59; McCain 39-Clinton 50) – Obama advantage 19 points
TX-22 (east Texas – McCain 52-Obama 45; McCain 59-Clinton 34) – Obama advantage: 18 points
AK-AL (whole state – McCain 48-Obama 43; McCain 56-Clinton 34) – Obama advantage: 17 points
IN-9 (south Indiana – McCain 44-Obama 43; McCain 54-Clinton 38) – Obama advantage: 15 points
CT-4 (Fairfield County – McCain 32-Obama 59; McCain 39-Clinton 53) – Obama advantage: 13 points
OR-5 (Portland area – McCain 39-Obama 52; McCain 47-Clinton 46; “rest of state” – McCain 45-Obama 42; McCain 50-Clinton 37) – Obama advantage 14 points in Portland area; 10 points in rest of state; weighed Obama advantage 13 points
NC-8 (Charlotte area – McCain 41-Obama 50; McCain 45-Clinton 43) – Obama advantage: 11 points
CA-11 (Central Valley – McCain 53-Obama 42; McCain 54-Clinton 35; Bay Area – McCain 29-Obama 62; McCain 37-Clinton 56) – Obama advantage: 8 points in Central Valley; 14 points in Bay Area; weighed Obama advantage: 10.5 points
IN-7 (Indianapolis – McCain 55-Obama 39; McCain 57-Clinton 31) – Obama advantage 10 points
NV-3 (Las Vegas area – McCain 41-Obama 44; McCain 49-Clinton 42) – Obama advantage: 10 points
NH-1 (whole state – McCain 44-Obama 46; McCain 49-Clinton 41) – Obama advantage: 10 points
AL-2 (southern Alabama – McCain 59-Obama 37; McCain 60-Clinton 30) – Obama advantage: 8 points
NM-1 (whole state – McCain 43-Obama 50; McCain 47-Clinton 47) – Obama advantage: 7 points
MN-3 (Twin Cities area – McCain 43-Obama 49; McCain 44-Clinton 46) – Obama advantage: 4 points
MI-7 (“rest of state” – McCain 47 – Obama 43; McCain 49-Clinton 42) – Obama advantage: 3 points
WI-8 (“rest of state” – McCain 42-Obama 49; McCain 44-Clinton 48) – Obama advantage 3 points
KS-2 (eastern Kansas – McCain 47-Obama 45; McCain 48-Clinton 44) – Obama advantage: 2 points
AZ-8 (Tucson & south Arizona – McCain 48-Obama 42; McCain 51-Clinton 44) – Obama advantage: 1 point
PA-10 (“The T” – McCain 53-Obama 41; McCain 54-Clinton 39; Northeast Pennsylvania – McCain 52-Obama 38; McCain 51-Clinton 44) – Obama advantage 3 points in “The T”; -7 points in Northeast Pennsylvania; weighed Obama advantage: 0.5 points
Competitive districts in which Obama and Clinton perform equally well (based on SUSA data in parentheses) – total of 2 districts:
AZ-5 (Metro Phoenix – McCain 53-Obama 38; McCain 54-Clinton 39)
LA-6 (“rest of state” – McCain 57-Obama 39; McCain 55-Clinton 37)
Competitive districts in which Obama performs better than Clinton (based on SUSA data in parentheses) – total of 10 districts:
I have listed the districts in descending order of their “Clinton advantage” number:
PA-4 (western Pennsylvania – McCain 50-Obama 37; McCain 47-Clinton 48) – Clinton advantage: 14 points
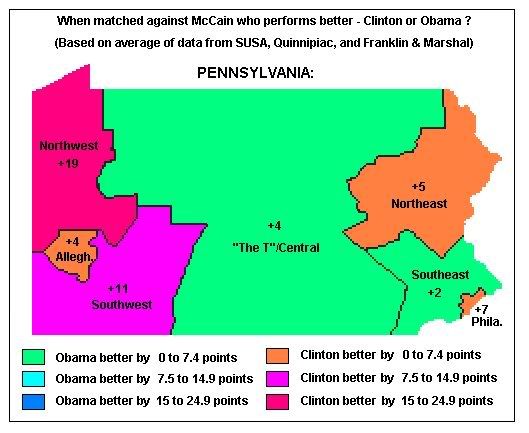
Pennsylvania is a weird state. It is the only state in which the SUSA data does not seem to match data from other pollsters – in regards to how Obama and Clinton perform when matched against McCain. The SUSA polling concludes that Hillary would perform better, while 4 other polls taken at the same time conclude otherwise – in those polls, Obama either performs better than Hillary or is essentially tied. I wrote about this in a previous diary where I examined other state polls from the last 30 days or so, and tried to gauge Obama’s and Clinton’s “electability” in various states — http://www.mydd.com/story/2008… —
This inconclusiveness may be a factor of the fact that Pennsylvania is the largest of the states which have not yet voted. Perhaps the voters there are still trying to make up their mind re. these matters, and thus the data currently available is still very fluid and subject to change.
Out of the four other Pennsylvania polls, two (Quinnipiac and Franklin & Marshall College) also break-down Pennsylvania by geographical area (you can link via the above diary). Re. PA-4, Quinnipiac actually gives Obama an advantage in Allegheny County, which forms approximately 2/5 of the district, while every pollster seems to agree that Clinton has the decisive edge in the rest of western Pennsylvania. Below is a map which I drew separately — just for Pennsylvania — and using not only the SUSA data, but data from Quinnipiac and Franklin & Marshall as well. In some ways, I feel that this is perhaps more representative of the state than just the SUSA numbers alone. The data is more precise (both Quinnipiac and Franklin & Marshall divide PA into more geographic areas. For example, while SUSA just has “southeast”, the two other pollsters have “Philadelphia” and “southeast” (the latter corresponding to the Philadelphia suburbs and Reading area):
FL-16 (southeast Florida – McCain 39-Obama 53; McCain 34-Clinton 61) – Clinton advantage: 13 points
NY-20 (upstate – McCain 43-Obama 46; McCain 38-Clinton 52) – Clinton advantage: 11 points
NY-25 (upstate – McCain 43-Obama 46; McCain 38-Clinton 52) – Clinton advantage: 11 points
NY-29 (upstate – McCain 43-Obama 46; McCain 38-Clinton 52) – Clinton advantage: 11 points
OH-15 (Columbus area – McCain 46-Obama 47; McCain 40-Clinton 51) – Clinton advantage: 10 points
NJ-7 (central New Jersey – McCain 39-Obama 46; McCain 36-Clinton 50) – Clinton advantage: 7 points
OH-16 (Cleveland area – McCain 34-Obama 54; McCain 35-Clinton 57) – Clinton advantage: 2 points
GA-8 (south Georgia – McCain 60-Obama 35; McCain 57-Clinton 33) – Clinton advantage: 1 point
NJ-3 (southern New Jersey – McCain 51-Obama 39; McCain 50-Clinton 39) – Clinton advantage: 1 point

4 Comments
Very nice
research. Thanks for posting this here. There’s a lot to sift through. It always seemed logical that Obama would be better than Hillary for other Dems up for election this fall, but this is helpful to see where it’s happening for both sides on a more comparative aggregate level.
drinksgreentea Thu 13 Mar 1:08 AM
to the shame of Obama supporters at Daily Kos
they let this diary scroll into oblivion while putting several repetitive diaries about Ferraro and Olbermann’s special comment on the recommended list.
Some of those people are beyond ridiculous. They do not help their candidate.
By the way, silver spring’s diary did make the rec list at MyDD, where readers reward analytical content.
desmoinesdem Thu 13 Mar 1:31 AM
Great stuff
Really interesting, thanks for all the work.
One point of interest to me is that Michigan looks like an Obama state in the match-ups. I wonder how that would be reflected in a potential revote in that state between Obama and Hillary?
On Ferraro, has she lost her mind? It’s one thing to say what she said. It’s actually a point that could be rationally discussed. (Of course, at the same time one could make the same argument about Hillary. She would not be where she is now if she was not a woman. Even during those 12 devastating blowouts, women stuck by her keeping her candidacy alive. And the Ferraro argument could be made about anyone. We are where we are because who we are. Hillary would not be a Senator if she wasn’t Bill’s wife.) Anyways, Ferraro’s defenses of herself seemed delusional.
rf Thu 13 Mar 12:50 PM
I agree with you
being a woman certainly helped Ferraro in some ways, as it is helping Clinton in some ways. Being a woman is also an obstacle for both of them, just as being black has helped Obama in some ways and hurt him in other ways during his political career and this presidential campaign.
Regarding what Ferraro was thinking, I think she forgot the rule that when you’re in a hole, quit digging.
Also, I think Kevin Drum got this one right:
http://www.washingtonmonthly.c…
desmoinesdem Thu 13 Mar 2:44 PM