Iowa’s seven largest cities are spending more on policing per capita and a greater portion of their municipal budgets on law enforcement compared to the 1990s, according to a new report by the Iowa Policy Project. Over the same time period, spending on social services per capita and as a share of the municipal budget has declined in six of those cities.
Colin Gordon and Peter Fisher authored “Policing, public safety and community priorities,” published on July 22 (also available in pdf format). They examined budgets for the 24 Iowa cities with populations of at least 20,000, because “it is in our larger urban settings in Iowa that the problems with policing — including a well-documented pattern of disproportionate minority contact — are most acute.”
Seven of the cities studied are “metropolitan”: Des Moines, Cedar Rapids, Davenport, Sioux City, Waterloo, Council Bluffs, and Dubuque. Seven are suburbs in large metro areas: West Des Moines, Ankeny, Urbandale, Bettendorf, Marion, Coralville, and Johnston. Three are college towns: Iowa City, Ames, and Cedar Falls. Seven are micropolitan cities: Mason City, Marshalltown, Clinton, Muscatine, Burlington, Fort Dodge, and Ottumwa.
The researchers noted, “Police and corrections make up only about 5 percent of all state and local government spending in Iowa,” a percentage that has changed little since the 1990s. But law enforcement comprises a larger share of city and county budgets.
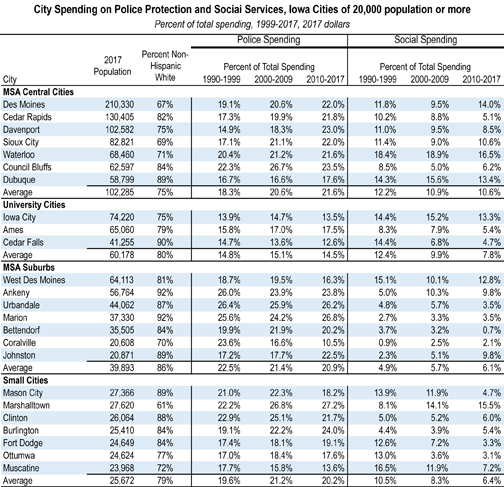
This table shows spending on police and social services (defined as “cash assistance, social services, health programs, housing and community development”) as a share of municipal budgets. Of the seven largest cities, only Des Moines spent more on social services in the 2010s than in the 1990s.
This table shows the spending on a per capita basis:
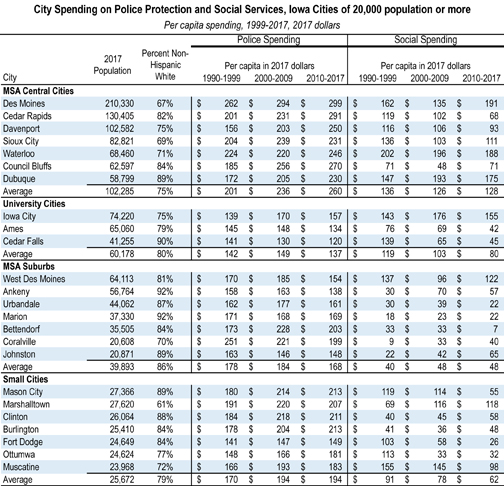
The trend line is different for the suburbs. In the 1990s, those municipalities were already spending a relatively large share of their budgets on policing. Several of them are now spending about the same proportion or less on law enforcement. Most of the suburbs are spending considerably less on social services than during the 1990s, but Ankeny and Johnston are spending much more.
The micropolitan cities are a mixed bag, with some spending more on police over time and some spending less. Mason City, Fort Dodge, Ottumwa, and Muscatine are spending much less of the city budget on social services compared to the 1990s. Burlington and Clinton are spending slightly more, and Marshalltown is spending considerably more.
The cities containing Iowa’s largest college campuses spend less on policing per capita and as a share of the budget than other cities with at least 20,000 residents. Gordon and Fisher speculated that was because the state universities have their own campus police forces. However, “This has not translated into greater funding of social programs, which have shrunk as a share of the budget” in the college towns.
During a press call on July 22, Gordon observed that their research highlights “the fundamental limits to home rule” in Iowa law. Although our state constitution says we have home rule, “local governments really do have their hands tied” when it comes to restructuring local finances. For instance, they can’t levy a new tax to pay for safety net programs. Fisher mentioned that the Iowa Policy Project has long advocated for increasing the minimum wage to reduce economic hardship. But when several counties moved to do just that, the Republican legislative majority and governor took that power away from them.
The new report contains a helpful tip on how Iowans can research law enforcement spending in their own communities:
Those wishing to investigate police spending in their city can do so readily with data available online. A copy of every city’s standard state budget reporting form for the past six years (fiscal years 2015 through 2020) is available on the Iowa Department of Management website. The form for the current year (fiscal year 2021) should be available from the city now, and on the state website soon. The very first item on the “Expenditures Schedule,” page 4, is “Police Department / Crime Prevention.” There you will find the total budget for the current year, an estimate of spending for the prior year, and actual spending for the year before that. To see how the police budget has changed as a percentage of the total budget, divide the amount in row 1 by “Total Government Activities Expenditures,” line 58. More detailed information on what the police budget goes for will be found in the city’s larger budget document, which should be obtainable from the city manager.
County budgets are also available online. On the Department of Management website, select your county, choose “county” in the second drop box, and click “Search.” Choose the budget for the year you want. When the budget appears, choose “SA1” on the left hand menu and wait. That will bring up the budget page with Law Enforcement spending itemized by uniformed patrol services, corrections, and other categories. Columns K, L and M will give you total spending for three years.
_______________
Appendix: Full news release from Iowa Policy Project on July 22
Opportunities to reform policing, community safety in Iowa
Report identifies key data, potential for reform in state, local budgetsIOWA CITY, Iowa (July 22, 2020) — Police spending per capita has grown over the past 30 years and consumes a greater budget share in Iowa’s seven largest cities, while social spending has on average declined, a new report shows.
The May 25 killing of George Floyd by Minneapolis police and other widely documented cases of police brutality have prompted large-scale protests in Iowa and nationally, and have put a fresh spotlight on police spending and police practices.
In their new report, “Policing, public safety and community priorities,” Iowa Policy Project (IPP) authors Colin Gordon and Peter Fisher identify spending trends by state and local governments, not only for policing but other key public services.
Among their findings:
· Police and corrections make up about 5 percent of all state and local government spending in Iowa, a level largely unchanged over three decades.
· The share of such direct spending by cities and counties has grown.
· Larger urban settings in Iowa have a well-documented pattern of disproportionate minority contact.
· The three state university cities — Iowa City, Ames and Cedar Falls — spend the least on police among cities of 20,000 or more. This may relate to separate university public safety departments in those communities. But social program funding has shrunk as a budget share in those cities.
· The share of budgets going to police in suburbs and smaller non-metro cities has varied, while budgets have shrunk for social services in many small cities.
· Police spending is not directly related to population diversity, regardless of city size.
· Spending levels tell nothing about how police practices might vary.“Public budgets represent our values and priorities,” said Fisher, IPP research director. “The average spending share for the seven largest cities in 2017 was 21.6 percent, and averaged over 20 percent for the other cities of 20,000 population or more, except for the university cities. The new focus on policing reform will have an impact across a wide range of priorities.”
Fisher said cities and counties do have options to meet locally identified needs from policing to social services, despite substantial constraints in state law on local control of funding options. The report, however, also pointed out fundamental change in funding of education, social services, and family supports will require state action.
“Cities account for lion’s share of expenditures on policing, but spend little on social services other than housing. Social supports and education, in turn, are largely the responsibility of jurisdictions — states, school districts — that spend little or nothing on policing,” the report stated.
The report notes current “push for change revolves around two arguments with budget and policy implications for police and other public services.
“The first is simply that our system is fundamentally broken,” the report notes. “The starkest evidence on this point is the pervasive and systemic racial inequity woven throughout our criminal justice system.
“The second argument is that a share of the resources we devote to policing could and should be spent more strategically and effectively. In this sense, the question is one of budgetary priorities.”
Gordon and Fisher do not make recommendations about police procedures, but lay a foundation of budget and debate context that Iowans may use as they “re-imagine” public safety.
“As Iowa communities grapple with these issues, it is important to understand the basic elements of proposals, the arguments and evidence behind them, and the policy and budget implications,” said Gordon, senior research consultant at IPP and a professor of history at the University of Iowa.
The report states the policy implications are wide-ranging. It specifically notes interest that has grown in one approach, community policing — considered less adversarial and oriented more than traditional policing to reconciliation, relationship development and local trust.
“It is the first priority of the city of Iowa City’s 17-joint response to demands of the Iowa Freedom Riders,” Gordon noted. “People in Iowa communities want to be at the table. This is particularly true for those who have been left out by a structure that has protected wealth and white power, skewing interactions between police and the broader community and people of color.”
The report notes that the state can play an important role in police operations at the local level, as shown by unanimous passage of a bill in June restricting police use of chokeholds, mandates de-escalation training and other measures. However, some lawmakers wanted other steps, including a study of racial profiling practices, and such proposals were left to future legislative action.
Find the report on the Iowa Policy Project website, www.iowapolicyproject.org.
Top photo: Cedar Rapids Police Department building, as pictured on the department’s Facebook page.