Dave Swenson
Anyone paying attention in Iowa knows that farmers benefited greatly from robust commodity prices during the earlier part of this decade, but that in recent years prices have slumped, as have the fortunes of farmers. Iowa’s farmers were credited (sometimes over-credited) with helping carry the state through the Great Recession because their boom years allowed them to buy new machinery and other agricultural durable inputs, which in turn multiplied through the Iowa economy. During down times, however, those magical multipliers stop working.
When commodity prices rose and profits soared, agricultural land prices followed: or more accurately, land prices and land rents chased away those profits – they always do. It is a problem now because both recent-buyers of agricultural land or those who locked into land rents are finding that current commodity prices are not supporting the prices they paid. And depending on the amount of debt held by an individual farmer, some are having difficulty accessing operating loans.
The situation some farmers find themselves in was covered nicely by the Des Moines Register’s Donnelle Eller recently. Citing USDA estimates, she noted: “U.S. non-real estate loans, such as operating notes, have climbed to an estimated $148 billion this year, a signal that cash reserves are being depleted.” Debt is rising, cash reserves are dwindling, and some farmers are having trouble getting credit.
This situation needs to be put into some perspective, however. To do that we need to distinguish between agriculture as an industry in Iowa and agriculture as a collection of businesses. We also need to look at the recent past to give us some clues as to the current ag-sector predicament we find ourselves in now.
The USDA provides annual financial estimates on Iowa’s farm operations through its Agricultural Resource Management Survey (ARMS). Part of that survey imputes the balance sheet characteristics of farms by size of operation as measured by sales. The first graph below tells us the share of assets, liabilities, and farms in Iowa that are found in the five economic groups ranging from sales of over $1 million down to sales under $100,000.
If we look at Iowa’s top two groups, those farms with more than $500,000 in sales, we get a clear picture of the distribution of debt (liabilities) and assets: Those two groups combined were just 20 percent of all farms, but they held 78 percent of all farm sector liabilities. Moreover, while their debt holdings were very high, comparatively, their asset shares amounted to 49 percent of the total. As these large operations have much newer, larger, and more expensive equipment, this means that these large operations have higher fractions of rented land, land purchase debt, equipment debt, or all three. Now, if we look at the bottom two groups, Iowa’s smaller operations, we see that they were 70 percent of the state’s 88,000 farms, but they accounted for only 17 percent of all liabilities. Conversely, they held 37 percent of the state’s farm assets. Their average situation is the reverse of their larger cousins.
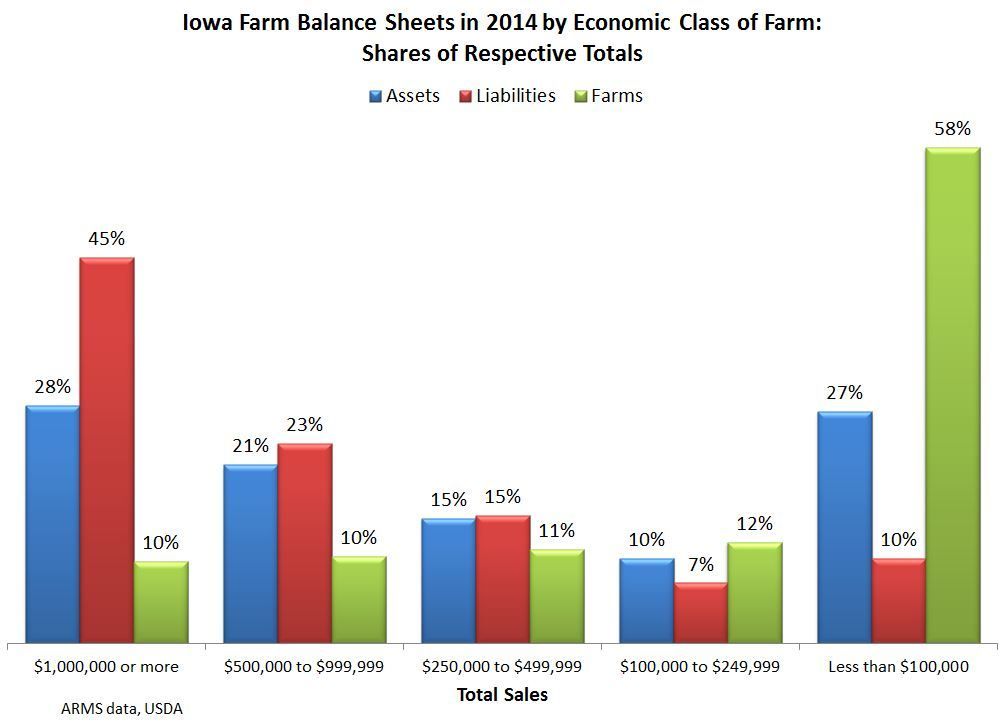
This is what I meant by farming as an industry. Only a fifth of Iowa’s farm operations accounted for 75 percent of cash sales in 2014 (ARMS data not shown) – three-quarters of Iowa’s ag economy were controlled by one-fifth of its farmers. And the data in the first figure show us their disproportionate share of debt relative to their share of assets.
This second graph simply presents the debt-to-assets ratio (expressed as a percentage) for the farm economic groups. The statewide average, the red line, in 2014 was 13.2 percent – weighted average liability amounts were 13.2 percent of the value of all assets. The rate, however, for Iowa’s largest producers, those with more than $1 million in sales, was 21.4 percent that survey year. The rates for Iowa’s smaller operations, those that represented 70 percent of farms were much lower at 9.4 percent for farms with up to $250,000 in sales, and 4.9 percent for those with under $100,000 in cash receipts.
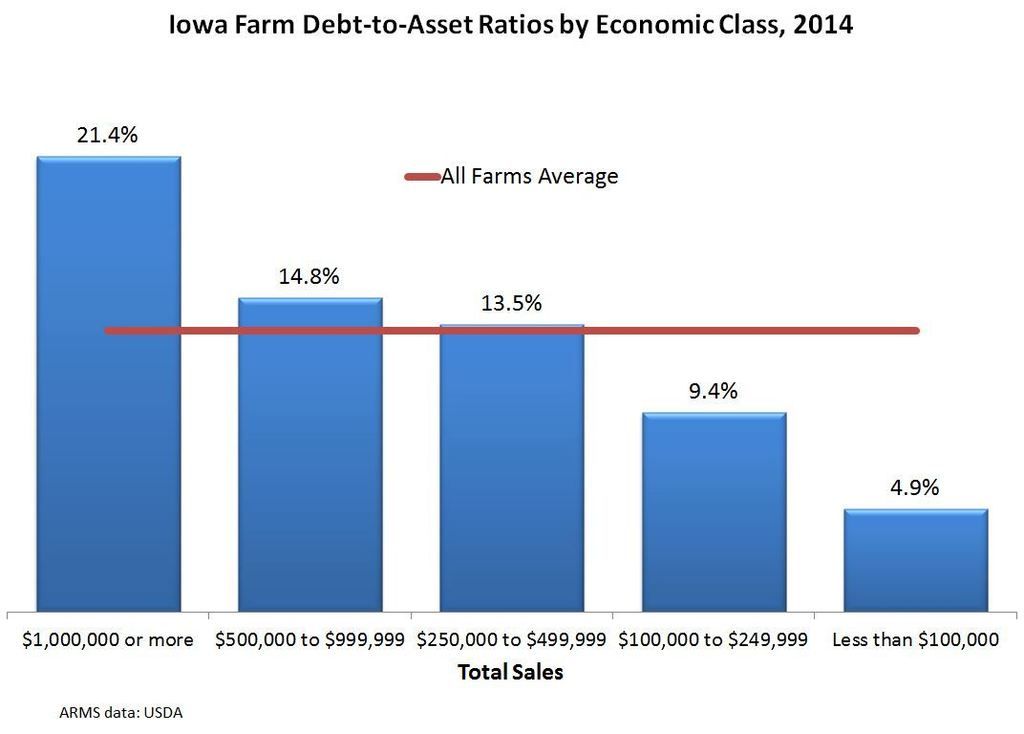
So, when we talk about agricultural financial stress, the balance sheets of the vast majority of farmers, as represented by these weighted averages, appear to be much better than those of the larger operations. In short, most farmers look to be in comparative healthy operating positions. However, a comparatively large fraction of Iowa’s ag economy is more highly leveraged and is undergoing some difficulty. The 10 percent of farms with more than $1 million in sales represented 54 percent of all Iowa agriculture cash receipts that year; hence, a majority of the state’s agriculture economy (not its farmers) may be more exposed to financial stress. One assumes the incidence of stress aligns with each economic class’s deviation from the state average.
This is not to diminish the fact there are certainly smaller operations that find themselves with undesirable balance sheets, but the USDA data indicate that current stress in the ag sector is disproportionately concentrated among large operations more so than it is a farmer-wide problem. The data tell us the vast majority of Iowa farmers have comparatively favorable balance sheets and accordingly, ought to have reasonable access to operating capital.
1 Comment
P.S. Age is important, too
I didn’t post the number above, but age of operator is important, as would be expected. Younger farmers will have had less time to accumulate assets relative to their obligations. Below are some relevant numbers, regardless of farm size, controlling for the age of the farm operator.
Debt-to-asset ratios for:
All Iowa farms 13.2%
Operators 34 years or younger 31.4%
Operators 35 to 44 years of age 27.4%
Operators 45 to 54 years of age 20.1%
Operators 55 to 64 years of age 11.9%
Operators 65 years or older 5.8%
In Iowa, in 2014, a little more than two-thirds of farm operators were age 55 or older, and both of those groups have debt-to-asset ratios below the overall state average.
Dave Swenson
daveswen Fri 18 Mar 12:55 PM