Dan Guild follows up on yesterday’s post about late-stage scenarios in the presidential campaign. -promoted by desmoinesdem
In 2008 I did state polling summaries at Open Left. That analysis originated from work I had done in 1996 which suggested the state polling was far more accurate than national polling. In 1996 the national polling was off by a considerable margin. I did the same analysis in 2012.
This is that analysis this morning.
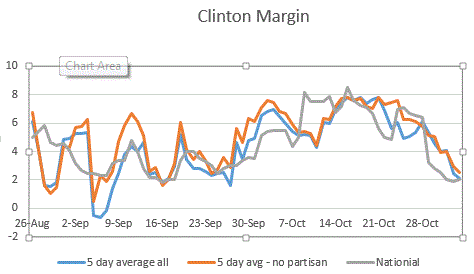
Clinton up by more than 2 in the state numbers. The tendency is for the state numbers late to be less volatile and with good reason. If analyzed properly they allow access to far more data (there have been over 40 polls in the last 4 days).
This documents the national polling versus the state average since 2000. Frequently it is more accurate. Also note the shift late in ’12 and ’00”. A similar shift would have an enormous effect. Note in both cases the state polling was better.
Think this is election is more volatile than 2012. It is. Where is the baseline for this race? I thought it was in late August. I am no longer sure.
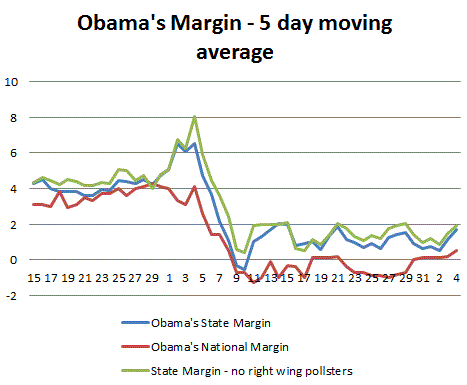
The same graph from 2012. The interesting thing is the final margin was close to the margin before the first debate. A good argument can be had about the impact of Hurricane Sandy. Another: that the effect of the debate unwound in the last 4 days before the election. There is a parallel here: one wonders if the Comey letter will follow a similar trajectory to the first debate in 2012. In the end the effect may, like the debate in 2012, prove minimal.
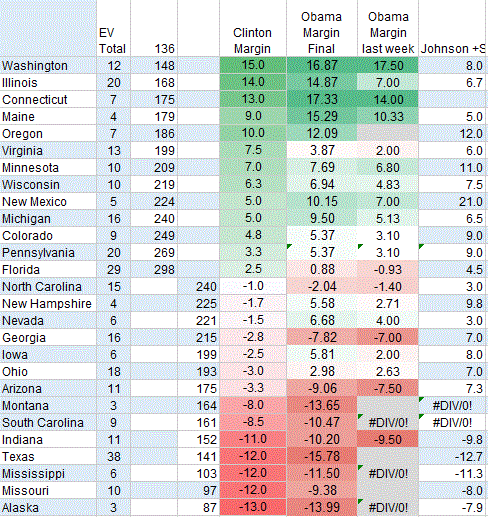
The cheat sheet I have been using. I think the Early Voting numbers suggest the polls are wrong in NV and NC, and the NC poll average is influenced by one poll – though the pollster in question – Survey USA is very good.. Still, this race can be lost. Yes, this has every poll since yesterday. Note the Johnson + Stein number at the far right. In 14 states with 173 EV’s the third party vote is larger than the Clinton margin. In 2000 the collapse of the Nader vote late allowed Gore to close.
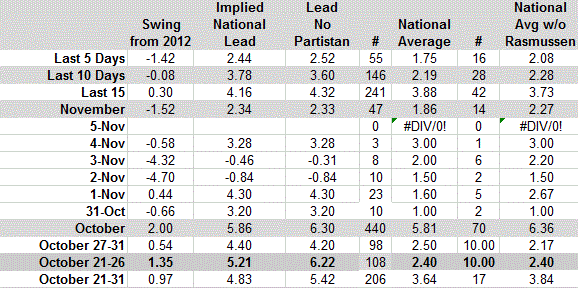
National Polls since this morning. Beware of looking in the rear view mirror. There is movement in IBD and ABC to Clinton. I still think Clinton wins by at least 5 as the third party vote, which is young, collapses and winds up with Clinton. There is evidence the Thursday sample in both polls looks like the period from October 21-26. That would imply a 4 – 6 point race.
This is what should be in everyone’s mind. This table shows the effect of national movement on the Electoral College. A 3 point national move to Trump would put Clinton on either 270 or 269 depending on a Maine CD. Polling missed by an average of over 3 in 2012 AND in 2000, 1996, 1992 and 1980. An upset is possible, though not probable.

