Iowa State University economist Dave Swenson examines “troubling” trends in seventeen mid-sized cities (“micropolitan” areas) with core urban populations of 10,000 or more. -promoted by desmoinesdem
Iowa’s metropolitan areas are growing, a few quite smartly, but a majority of Iowa’s nonmetropolitan areas are declining, several quite sharply. These changes have implications for the vitality of and outlook for much of rural Iowa. They also have implications for dominant rural political attitudes.
As rural economies and populations transform, so too do their collective public policy preferences. Recent statewide and federal election results show clearly that nonmetropolitan Iowa has become more conservative than its historically-conservative norm. And current indications give us no reason to expect that trend to abate.
Persistent population and commercial declines are the most durable features of Iowa’s rural areas. Forty-one of Iowa’s 99 counties realized their peak populations by 1900 or earlier. A full two thirds maximized their populations by 1950. Most of Iowa’s counties have been shrinking for a very long time, and during the 1980s, the entire state contracted by 4.7 percent owing largely to the farm debt crisis. Forty-eight counties suffered double-digit percentage losses then. Of them, only Black Hawk County was a metro.
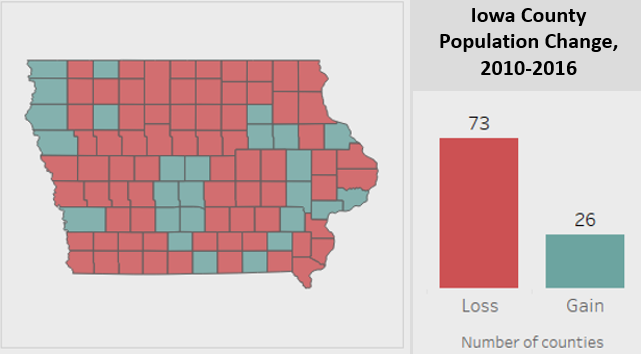
Though Iowa recovered during the 1990s, this simple fact endures: Iowa had the nation’s slowest population growth rate in the 20th century. And thus far this decade, 73 counties were smaller in 2016 than they were in 2010.
Rural Iowa is shrinking, but it is not disappearing. Iowa is relatively evenly settled and is thus dotted with over 900 communities, 40 of which serve as nonmetropolitan regional trade centers – counties containing cities of from 5,000 to just under 30,000. We pay particular attention to these cities because a large fraction of Iowa’s nonmetro residents work, shop, and seek and receive health care and other services from these centers. They are rural Iowa’s socio-economic anchors, and their collective and individual vitality is important to monitor and maintain.
But most of them are not doing well on a comparative basis. Some are struggling profoundly. Others look stable, but their surrounding areas are thinning. Only a few are growing.
Of these rural trade centers, there are seventeen nonmetro areas with core urban populations of 10,000 or more for which reliable economic data are available. They are called micropolitan statistical areas. They contain Iowa’s major mid-sized cities.
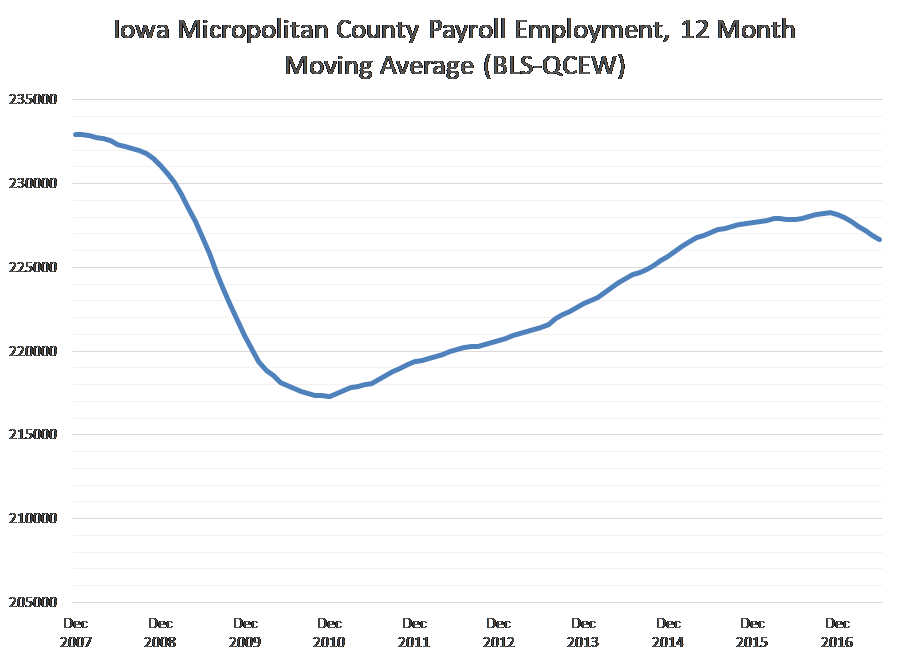
This first graph shows they have not as a group recovered employment levels enjoyed before the great recession. These cities are more likely to depend significantly on manufacturing jobs, were more likely to have endured much higher unemployment levels than the state average over the course of recovery, and typically suffered longer average durations of unemployment. It is troubling to see that their recovery has stalled and is in fact moving in the wrong direction of late.
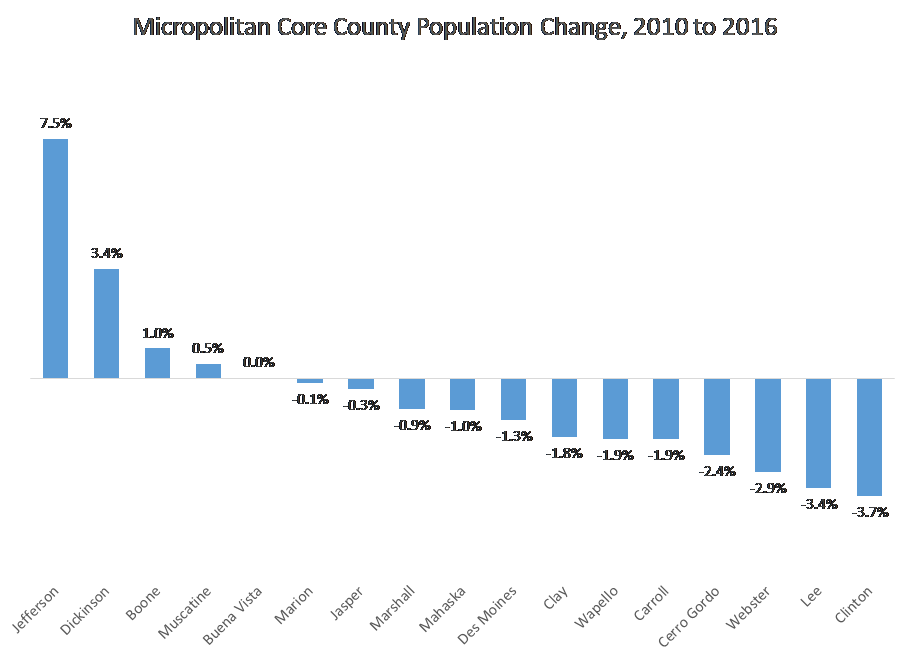
This next graph helps us understand the magnitude and distribution of population decline among this group just this decade. Of Iowa’s seventeen micropolitan core counties, only four realized growth, led by robust gains in Jefferson County and less but still strong growth in Dickinson County. Of those declining, Clinton, Lee, Webster, and Cerro Gordo County have much higher rates of loss than the overall group average decline of -1.0 percent. These are the home counties of Clinton, Fort Madison, Keokuk, Fort Dodge, and Mason City.
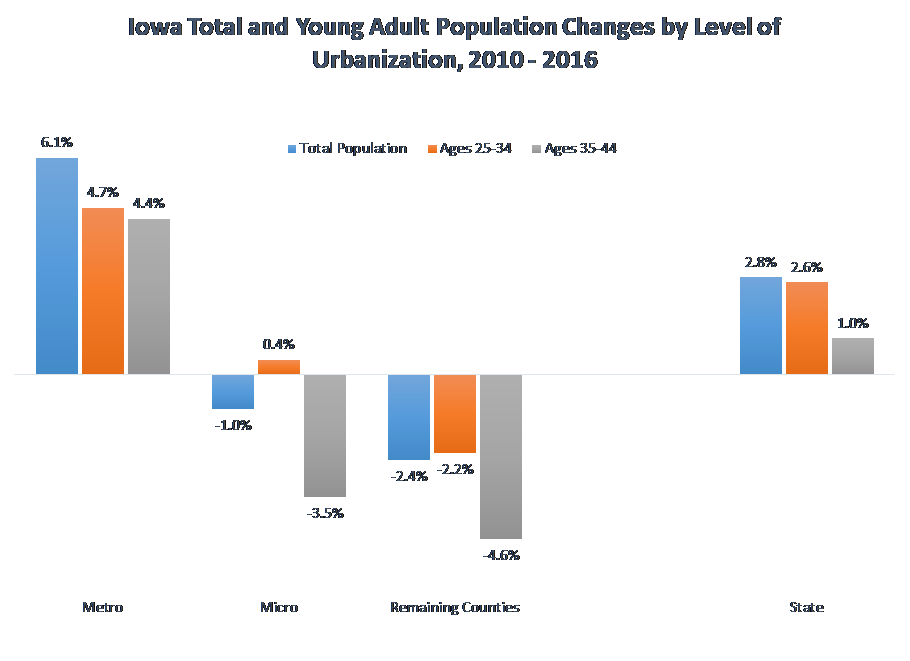
The last graph is most revealing. It summarizes the population changes thus far this decade by level of urbanization (metro, micro, and all remaining counties).
Displayed also are two key age cohorts, those 25-34 and those 35-44, which tell us much about the state as a whole and the different county groups. That is because these age groups provide intrinsic insights into regional economic and social prospects. The younger group is the skill acquiring component of the population and the next group is the skill applying subset of this still comparatively young workforce. All growing economies and socially vibrant communities need a stable supply of people these ages. They provide labor to regional businesses, they create value added as their skills improve and, concomitantly, their own pay improves. Many, especially those in the older group, become community leaders across a wide range of civic, social, and cultural institutions.
It is clear that Iowa metro total populations and their young adult populations have posted robust gains this decade. In contrast, Iowa’s micro and all remaining counties are mostly shedding people. Although the micros show minor gains in the 25-34 age category, the decline in residents ages 35-44 is pronounced. And for the remaining Iowa counties, the population declines are substantially worse across the board.
Further, the reduction in the number of young adults, particularly those in the age 35-44 category, in the nonmetro areas is also matched with similar percentage reductions in children ages 0-19. This trend foretells a discernible population loss “echo” that will be evident among most of these counties in ten or 15 years.
What do economic stagnation and population loss suggest regarding political attitudes, political influence, and policy choices? First, it is abundantly clear that the overall abilities of most nonmetro governments to provide public goods is eroding. Communities, counties, and schools must make hard choices about pubic services in light of stagnant-to-declining tax bases, fewer households, and paltry income growth. There is in Iowa a clear and growing distinction in the breadth and substance of nonmetro versus metro public goods. One needs only to visit the declining micros to see the evidence.
Second, nonmetro Iowa is incrementally aging as each decade posts fewer and fewer younger households and families. Older voters are less inclined to support conventional local public goods provision than younger voters with children. They are less prone to favor school bond issues, new parks or recreation facilities, or state policies that appear to benefit growing metropolitan residents more so than struggling rural residents.
Third, the difference in average educational attainment between metropolitan and nonmetropolitan voters is growing. The metro county (unweighted) county average of adult residents with at least a bachelor’s degree was 28.3 percent according to the most recent Census estimates. The micro’s fraction was 21.0 percent, and all other Iowa counties scored 18.0 percent. Higher educated and otherwise more skilled workers have the greatest mobility, and the previous graph demonstrates clearly which parts of the state are attracting or shedding people. Further, research consistently confirms that liberal policies and programs rise consistently with educational attainment in an area.
There are multiple rural development initiatives in Iowa. There have been for decades. None, however, will alter the underlying and long-standing dynamics of change we are witnessing. Population and economic growth gaps between metropolitan and nonmetropolitan Iowa will widen over time, and the degrees to which the two dimensions diverge will be inevitably reflected in their respective social and political preferences.
2 Comments
True for most rural communities?
IF this is true about primarily rural states generally then one political implication is that rural voters will continue to have increasingly disproportionate influence in the US Senate because of the small state bias.
Caretaker Mon 19 Feb 11:01 AM
I'm not willing to give up
Great research. The conclusion is so fatalistic. I believe the challenges are great and well documented by Swenson. But I don’t believe there is simply no path to a preferred future. That the pieces to put together and the levers to pull have not yet been identified does not mean they don’t exist.
Matt Russell Mon 19 Feb 11:36 AM