Jon Muller challenges a “Big Myth” about the economy, which drives some voters toward leftist candidates rather than more viable centrist Democrats. -promoted by desmoinesdem
I got wrapped up in a couple of heated arguments after this week’s special election in Ohio’s twelfth Congressional district. According to those sympathetic to the Green voters, the problem was a choice of two Republicans. This was a rehash of frustration surrounding Green Party voting in the 2016 general election in the Great Lakes states.
Whether that voting, either in 2016 or in OH-12, tipped the election is not pertinent. Rather, this is an exploration of their position and the underlying grievance. The rejection of a centrist Democrat dismisses two central realities:
1. No leftist candidate is ever going to win in this Ohio district. It’s a choice between a centrist Democrat and a Republican. There is no other option. In most election cycles, the choice isn’t even that good.
2. One of those Republicans is going to caucus with Democrats and vote for a Democrat for speaker of the House, who will be able to bring Medicare for All to the floor. The other will be voting for a speaker who will continue to erode hard-fought gains. Should the left insist on leftist candidates in all Congressional districts? Or should the left work to nominate the least conservative viable candidate, or at least support them when they show up on the general election ballot?
In the course of these arguments, I was reminded again of the Big Myth from the left: Things are worse than they’ve ever been, and there has been no improvement in living standards for the past 30 years.
This unquestioned truth, now almost conventional wisdom, is essential to the conclusion there is no distinction between a centrist Democrat and a Republican. Not a sliver of daylight between them. Therefore, only leftist candidates should receive support against Republicans, even in Republican-leaning districts. Indeed, if the assertion were true, their actions may be arguably rational.
Does the underlying premise hold water? Have our living standards been frozen in time? It’s true that the 1970s were a difficult time. Anyone who lived in that decade knows how bad it was. The data bear that out. And then the 1980s were Happy Days for the rich, but brutal on the poor who saw entitlements cut back in a grand social experiment. The data bear that out too.
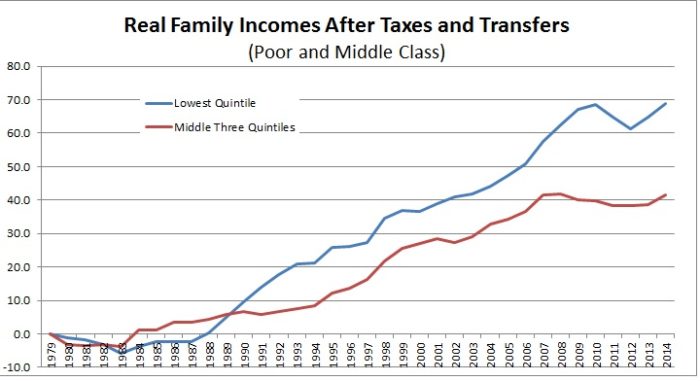
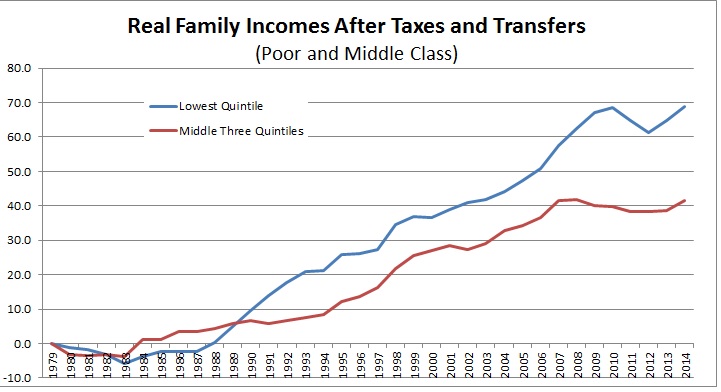
But since the late 80s, Real Family Income After Taxes and Transfers has grown precipitously. Living standards by this measure have increased 69 percent for the poor. That’s a REAL dollar number. For the middle class, a less impressive 42 percent. But improvement nonetheless. The poor and middle class are, generally speaking, half again better off over the past few decades.
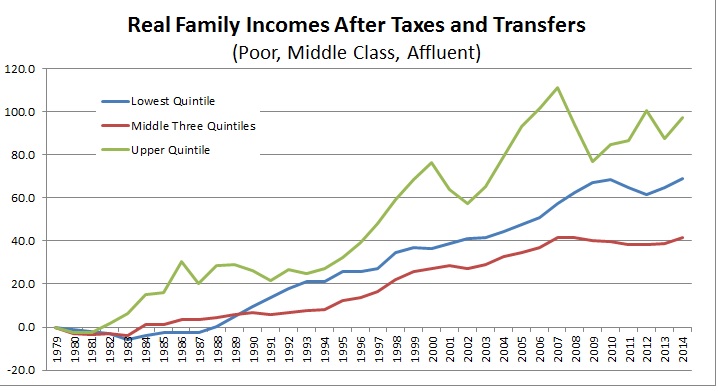
So what is all the fuss? If we put the top 20 percent of households on that graph, you see that the merely affluent are doing much better. Their real incomes have almost doubled. But you can still see improvement at every quintile.
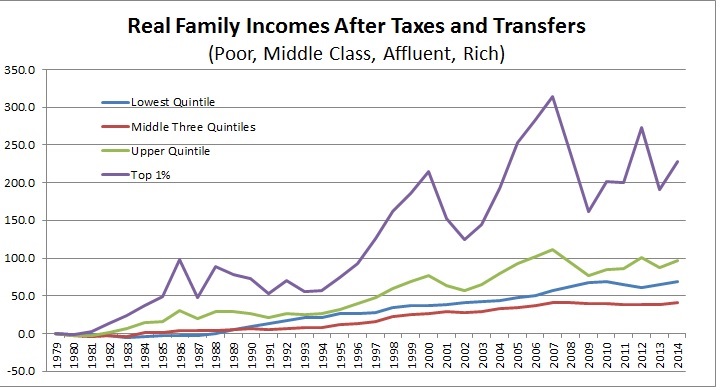
The grift comes into play when you add the very top 1 percent. Simply by changing the scale on the vertical axis, we make it look like the entire system fails everyone. It appears the rich throw some spoils to the merely affluent to keep down the poor and the middle class. Hence, one social media adversary concluded, “Fact is in the last 30 years nothing has gotten better for the bottom only the top.”
The Big Myth is that anti-poverty programs, globalization, and economic growth have not improved living standards. They have. For all income cohorts. It is true that gains for the rich have been grossly out of step with the bottom 99 percent. That vast inequity, growing over time, is a recipe for both Bernie Sanders and Donald Trump. While I’d enthusiastically support the former over the latter (even if either of them had a massive stroke) surely there’s a path that doesn’t seek to unwind all the progress that’s been made.
While we in the U.S. have realized measurable gains, in step with most modern capitalist welfare state democracies, the developing world has achieved even more. And we resent that for some reason, even though they haven’t come close to achieving our living standards, with few exceptions. Indeed, the gains we have made are in large measure attributable to their gains. That was both the promise and the realization of a global economy.
That’s where the problem begins. We’re no happier now that we’re 50 percent more affluent, by and large. Frankly, we don’t even believe we are. And we never will. The more prosperous that people become in other parts of the world, the worse we feel about ourselves. Our culture has a bug. Maybe its endemic to our species. Whatever it is, it makes us lose sight of solutions as we blame less fortunate people and countries for our troubles….troubles that are not nearly as bad as they used to be, nor nearly as bad as they are in the countries we resent the most. And that, my friends, is what makes us so unrecognizably ugly.
We feel better when we make other people feel worse. So we wage election battles by making people feel worse about themselves, both spatially and temporally: Spatially, comparing ourselves to other nations today; Temporally, within our country across time. The former being a misunderstanding of economic slack and potential, and the latter an epic myth.
Notes and Data Discussion: Charts created from data compiled by the Congressional Budget Office. The publication is from May 2018. It is likely that all income cohorts have realized significant growth in Real Family Income After Taxes and Transfers since 2014, the last year in the data set. It is also quite likely the top 1 percent has continued to achieve outsized gains, in large part due to federal tax cuts that magnified the inequities, a public policy that is exactly the opposite of the solution to these problems.
Lastly, with respect to the concept of the income measures themselves, Affordable Care Act and medical trend costs helped to increase living standards for the bottom 3 quartiles. Medical transfer payments are by far the largest, followed by SNAP (food stamps). However, SNAP payments had already started to fall by 2014, and have fallen further since then as income from employment has replaced transfer payments. It is tempting to dismiss higher medical care benefits as contributions to living standards. That would be a mistake. It is something people consume, across the income spectrum, and something people derive ever increasing benefit from, at least those with access. That said, living standards even before transfer payments and taxes have increased over the past 30 years for all quintiles. For the 30 years ending 2014: 34 percent, 28 percent, 59 percent, and 163 percent respectively.