UPDATE: Hours after this piece was published, the plus/minus feature disappeared from the state website. Original post follows.
The state of Iowa’s official website for information about the novel coronavirus pandemic incorporated a few tweaks this week. The most noticeable: Department of Public Health staff update various statistics throughout the day, rather than once in each 24-hour period. During her May 18 news conference, Governor Kim Reynolds asserted that the new practice would make data on COVID-19 more “transparent.” Critics pointed out that the frequent updates would make it harder for Iowans to keep tabs on daily changes in coronavirus cases, tests, hospitalizations, and deaths.
Reynolds didn’t announce another addition to the website, which has attracted relatively little notice. Several of the bar graphs can now be adjusted to project the number of daily cases, tests, hospitalizations, or deaths weeks or months into the future.
The trouble is, those projections are not grounded in any principles of epidemiology.
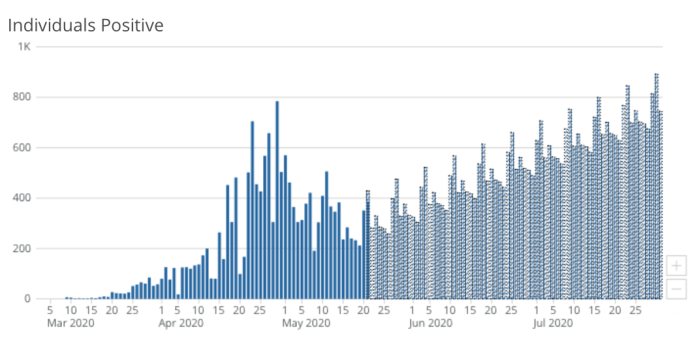
Ian Lyttle brought the new feature to my attention on May 20, after he noticed that clicking the [+] box near the lower right corner of some graphs would bring up additional bars. Here’s how COVID-19 case numbers would supposedly increase through July.

Oddly, the site predicts that numbers will occur in a repeating weekly cycle, with cases ticking up a little more each week. By mid-July, between 600 and 800 Iowans would be added to the COVID-19 positive ranks every day.
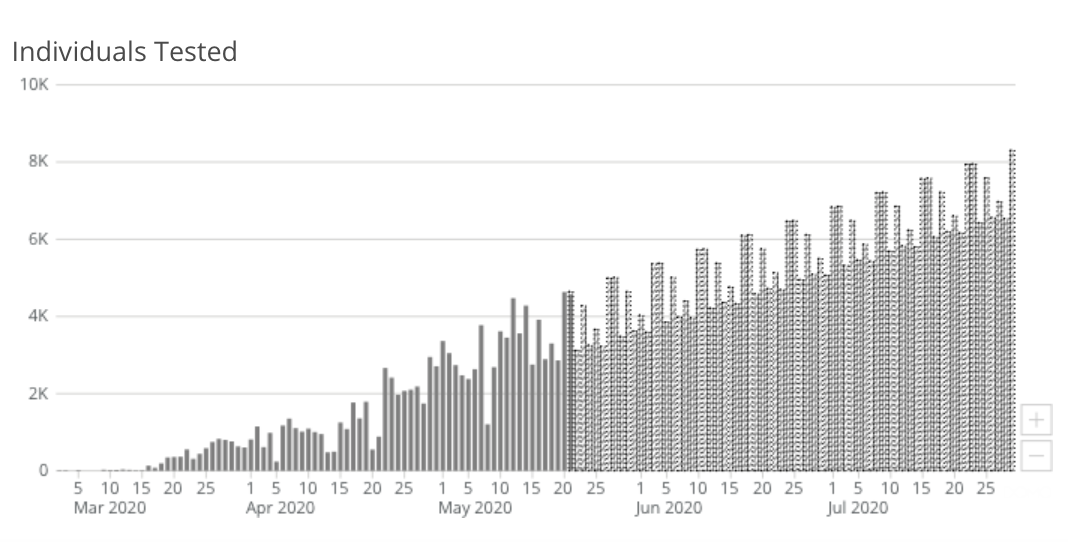
The number of individuals tested will follow a similar pattern, the site projects.
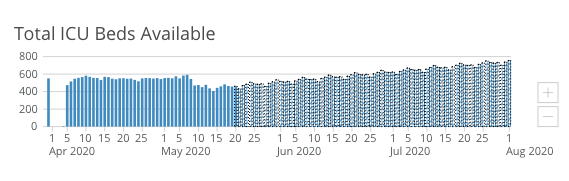
Somehow, though, the number of ICU beds available in Iowa hospitals will inch up over the same time frame.
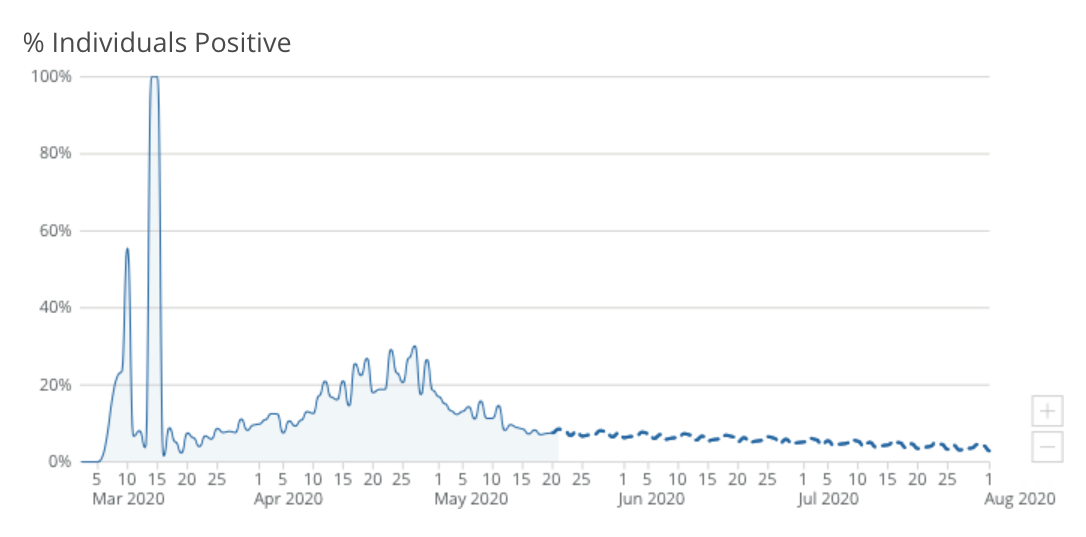
Maybe that’s because the percentage of Iowans testing positive is seen steadily decreasing.
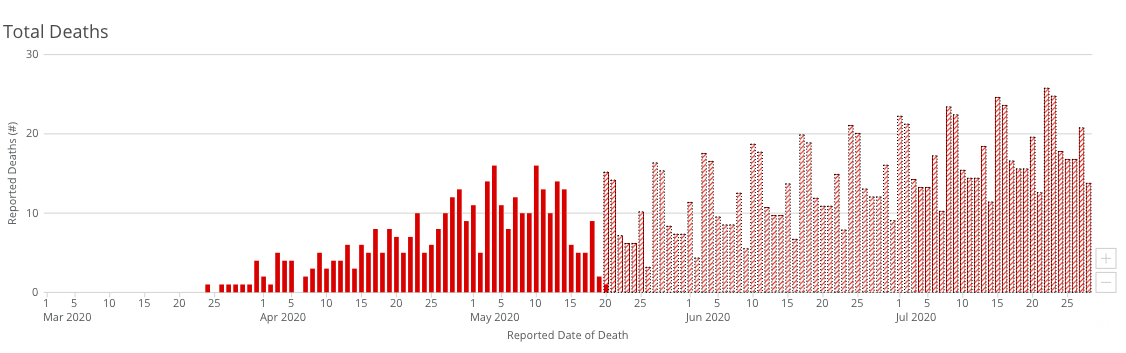
However, the site projects that coronavirus deaths will follow a repeating, gradually increasing pattern until we’re losing at least fifteen Iowans a day by early July.
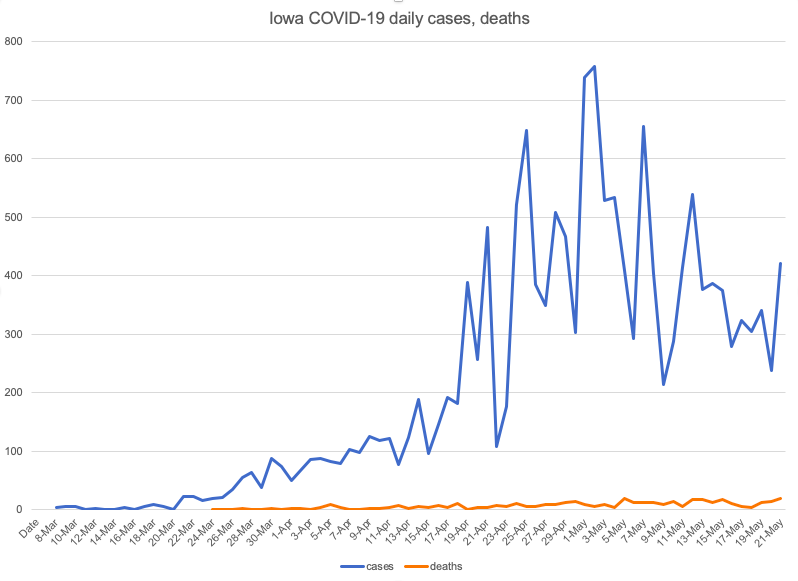
You don’t have to be an epidemiologist to realize that disease spread doesn’t follow this kind of sequence. This chart show the COVID-19 cases and deaths reported in Iowa each day since the virus was identified here in early March.
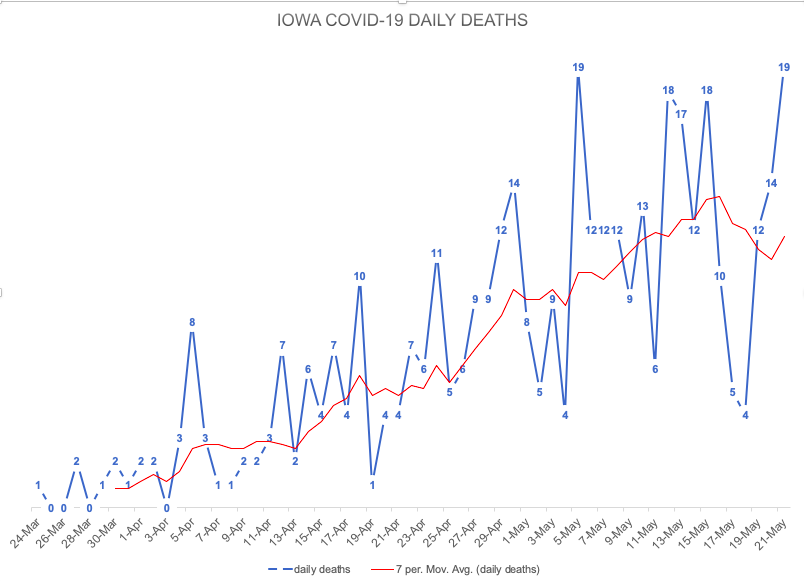
This chart shows the daily deaths reported in blue. The red line reflects the seven-day moving average.
To all appearances, whatever tool was used to create the graphs on coronavirus.iowa.gov has some kind of default setting that spits out future numbers based on previously entered data.
Iowa Department of Public Health communications staff did not respond to Bleeding Heartland’s inquiries about the basis for these projections. Did the agency’s epidemiology team come up with these figures, and did they take into account the governor’s recent decisions to relax various COVID-19 mitigation policies?
I also sought comment from Professor Joseph Cavanaugh, the head of Biostatistics at the University of Iowa who is leading the team of researchers under contract to provide Iowa-specific modeling to the Department of Public Health. These projections look nothing like the graphs in materials Cavanaugh’s team has submitted to the state agency. Nevertheless, I asked whether they were derived from any modeling produced by the University of Iowa.
Cavanaugh replied via email that he was unaware of the new website feature and “can assure you that these projections are not based on our modeling results.” He added,
it appears that the case and mortality “projections” are simply based on repeating the pattern for the previous week, and adding a positive increment. I’m not sure how the positive increment is derived, but it seems that the same increment is used from one week to the next. As you’ve probably noted, the weekly recurring pattern appears to be deterministic as opposed to stochastic.
He speculated that the method might be a work in progress by the Utah-based firm that was hired to build a new COVID-19 dashboard for Iowa last month. That company, Domo, was to adapt its “COVID-19 Crisis Command Center” and build a website as part of the $26 million no-bid contract the state signed with Nomi Health to create the Test Iowa program.
Cavanaugh said that while the dashboard “features a wealth of valuable information,” the forecasts “are very misleading, and do not reflect established epidemiological or biostatistical principles, such as the intrinsic nature of an epidemic curve.”
The IDPH should remove that function from the website as soon as possible, so Iowans don’t get the wrong impression about what the future holds.
For those interested in scientifically informed scenarios for the trajectory of COVID-19 in Iowa, I have some good news. The University of Iowa’s research team has been developing an app for public use, which will be available here when finalized. Cavanaugh told me,
The app will allow the user to specify various inputs and examine their impact on epidemic curve projections. The app will also feature links to additional resources and results, such as current reproductive number estimates and daily projections for mortality and infections.
Bleeding Heartland will review the new app shortly after its release.
UPDATE: Iowa Department of Public Health communications staffer Amy McCoy responded on the morning of May 22 to my email inquiry, “I don’t think they are projections, I think it’s just something with the program (it looks like a placeholder pattern), but I’m checking.” Soon after, the feature was removed from the website.
I didn’t write this post immediately after seeing the projections, because I thought the department might correct the errors after I alerted them the the problem on May 20. I wrote the piece after more than a full day had passed, I’d heard nothing back, and the functionality was still there late on the evening of May 21.
2 Comments
Thanks
Thank you for keeping Iowan informed. You are providing a vital service in a dark time. Thanks for what you do.
boji Sat 23 May 12:05 AM
Professionalism
I don’t understand how anyone could question your professionalism or fairness and deny you the access you deserve as a reporter and journalist.
openureyes Sun 24 May 9:17 AM