Evan Burger: Despite census delays, what we know about Iowa’s redistricting process allows us to say a surprising amount about how the new Congressional districts will look. -promoted by Laura Belin
Last month, I wrote that census delays might prevent the Iowa legislature from fulfilling their constitutional requirement to finish redistricting by September 1. Since then, the U.S. Census Bureau announced that they will not finish compiling the data necessary for redistricting until September 30, so the legislature is now guaranteed to miss their deadline.
All eyes are now on the Iowa Supreme Court. Will the justices exercise their authority to take over redistricting on September 15, or will they give the legislature more time to finish the standard redistricting process? So far, the judicial branch hasn’t said.
How the legislature will handle the delay is also not clear. Facing a similar situation, California legislators asked their state supreme court for an extension of the constitutional deadline, which the justices unanimously voted to grant. Legislative leaders in Iowa have not said whether they will take a similarly proactive approach. Iowa Capital Dispatch and Radio Iowa have quoted Senate Majority Leader Jack Whitver and House Speaker Pat Grassley as saying they are evaluating their options.
The census delays continue to add uncertainty into Iowa’s redistricting process. But we do know some things about redistricting – and that allows us to say a surprising amount about how the new districts will look.
WHAT WE KNOW
Here are some things we know for sure about redistricting in Iowa:
1. Each Congressional district will be made up of whole, contiguous counties.
The state constitution addresses the drawing of Congressional districts in Article III, Section 37, which reads in its entirety:
Congressional districts. When a congressional district is composed of two or more counties it shall not be entirely separated by a county belonging to another district and no county shall be divided in forming a congressional district.
In other words, U.S. House districts must be made up of whole counties, and those counties must be contiguous.
Iowa Code Chapter 42.4(3) clarifies that “Areas which meet only at the points of adjoining corners are not contiguous,” and that Congressional districts “shall be reasonably compact in form.” The same section provides two methods for measuring the compactness of a district: length-width compactness and perimeter compactness.
Length-width compactness is calculated by measuring the distance between the northernmost point of the district and the southernmost point of the district, then measuring the distance between the easternmost point and the westernmost point of the district, then calculating the difference between the two. Perimeter compactness is easier: it is simply the distance of the perimeter of a district.
In both cases, a smaller number indicates a more compact district. And in both cases, the compactness of an overall map of multiple districts can be calculated by adding up the compactness of each district in that map.
2. Iowa’s population must be equally distributed among the Congressional districts.
Chapter 42.4 of Iowa Code says that “No congressional district shall have a population which varies by more than one percent from the applicable ideal district population, except as necessary to comply with Article III, section 37 of the Constitution of the State of Iowa.” The ideal district population is “determined by dividing the number of districts to be established into the population of the state reported in the federal decennial census.”
However, as described in the excellent Legislative Guide to Redistricting in Iowa, published by the Legislative Services Agency (LSA), federal courts have applied an even stricter standard to population variation between districts, based on the concept of “overall range percentage variance.” That metric is defined as: “the difference in population between the most populous and least populous districts in a redistricting plan[…] divided by the ideal population, expressed as a percentage.” Federal courts have rejected redistricting plans with overall range percentage variance as low as 0.69 percent, and accepted redistricting plans with overall range percentage variance as high as 0.73 percent.
Thanks to Iowa’s nonpartisan redistricting process, our Congressional maps stay well within both the 1 percent limit in the state constitution, and the stricter standard applied by federal courts. The overall range percentage variance of the congressional maps approved in 2011 was 0.01 percent. In other words, the LSA managed to draw four Congressional districts where the largest had a population of 761,624 and the smallest had a population of 761,548 – an impressive feat that speaks to the power of modern redistricting software, and to the LSA’s commitment to equal district populations.
Even if Republicans manage to override the current redistricting process this year – either by exercising their ability to amend the third redistricting plan presented by the LSA, or by changing the statutory process outright – the guardrails established by federal courts mean we can be certain that the districts will be virtually equal in population.
3. Iowa will have four Congressional districts.
Since Iowa’s population is growing more slowly than the country as a whole, we have been losing Congressional seats in recent decades: in 1991 we went from six U.S. House seats to five, then lost another seat in 2011, bringing us to our current four.
Are we at risk of dropping even further, to three districts? By comparing Iowa’s estimated population to the national estimated population, we can say with a high degree of certainty that we are not. No public analysis, including the Census Bureau’s own estimates, has listed Iowa as a state at risk of losing (or gaining) a seat. Having just lost a seat in 2011, our population puts us firmly in the four-seat category.
4. We know roughly how many people live in each county, and how residents of those counties voted in past elections.
The federal census results are the only population counts that are accurate and precise enough for the LSA’s redistricting process. But the Census Bureau also produces annual population estimates, which tell us roughly how the population of each county has changed since the 2010 census.
We also know how residents of each county voted in past elections. Iowa Code explicitly forbids the LSA from using any partisan data in drawing district maps, and legislators are forbidden from using partisan data as justification for choosing one map over another. But neither prohibition applies to members of the public, and county-level breakdowns of votes in all recent elections are readily available on the Iowa Secretary of State’s website.
WHAT DISTRICTS ARE POSSIBLE
By applying the rules of redistricting together to the latest population estimates, we can predict what districts could result from the redistricting process, and which ones we can rule out. Then, using past voting behavior, we can predict the partisanship of any hypothetical future district.
Several websites exist to help in exactly this task, including DistrictBuilder, Districtr, and Dave’s Redistricting App (DRA). DistrictBuilder does not yet support Iowa maps and so is not relevant for our purposes. Districtr is the most user-friendly, but it uses 2010 census counts for population, which are now so outdated that they are functionally useless. DRA is pretty accessible and offers the option of using 2018 population estimates instead of 2010, so that is the tool I used to produce the maps below.
Again, the population counts in DRA (and every other tool) are estimates, so they will diverge to some degree from the 2020 census numbers that will be released in September. For the maps below, I limited myself to districts within a 1 percent variance from the ideal population. That range allows for the inevitable differences between the 2018 population estimates that DRA uses and the final census numbers. As described above, the population variance of actual districts that could pass a court challenge is much smaller, but until we have census numbers we should use a wider window of possibility.
One other methodological note: DRA does not offer a way to look at Congressional voting behavior specifically. It does offer a “Composite 2012-2018” score, but looking at presidential and gubernatorial voting behavior is an imperfect proxy for congressional voting behavior. That composite score also makes Iowa look much bluer than it actually is, since it includes 2012 results (when Iowa voted for Barack Obama) and ignores 2020 results (when we went for Donald Trump). Each party’s coalition has evolved drastically since 2012, and as long as the GOP is the party of Trump (i.e., for the foreseeable future), Iowa is much redder than DRA’s numbers would suggest.
So for the analysis below, I compiled this spreadsheet of each county’s voting behavior in each of the last three congressional elections. In the spreadsheet, I ignore third-party and write-in votes to isolate the partisan lean of each county. I used that dataset to calculate the partisan lean of each hypothetical district below rather than the scores available within DRA.
With those notes out of the way, let’s dive in! For this article, I’ve produced eight maps, focused on the bluest and reddest districts possible.
Polk County
The first county we’ll look at is Polk. As the largest county in the state, it will dominate whichever district contains it. When looking for the bluest district possible, Polk is a good place to start.
1A: Polk-Story-Johnson
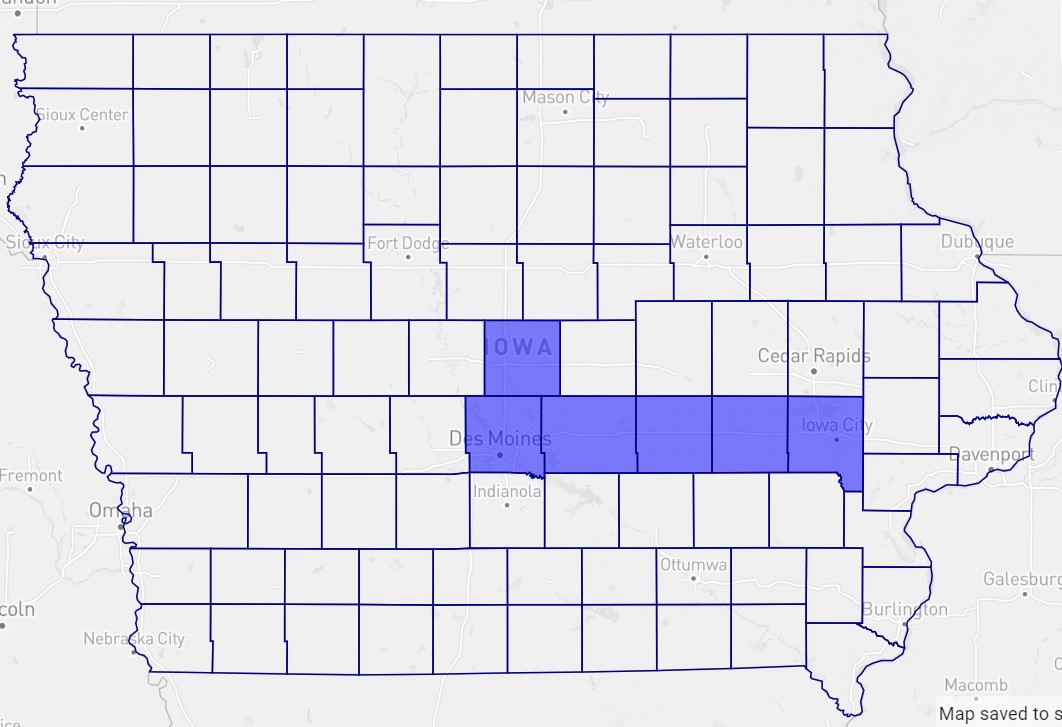
A classic tactic of gerrymandering is to lump all your political opponents together into one district – and if Republicans had free rein in Iowa’s redistricting, they might come up with a map like this one. Polk is joined by Story and Johnson, the homes of the state universities that Iowa Republicans love to hate.
This district is the bluest possible district that includes Polk, as shown by how these counties voted in the past three congressional elections:
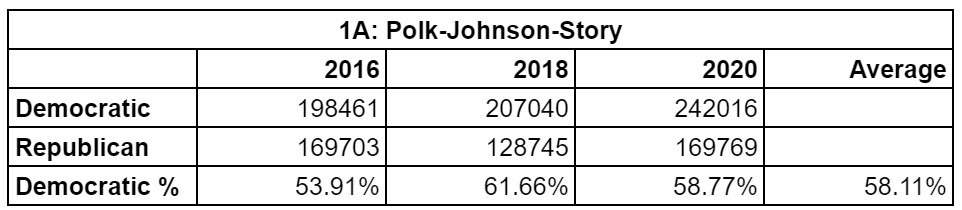
The partisanship of this hypothetical district is almost exactly the inverse of the current fourth Congressional district:
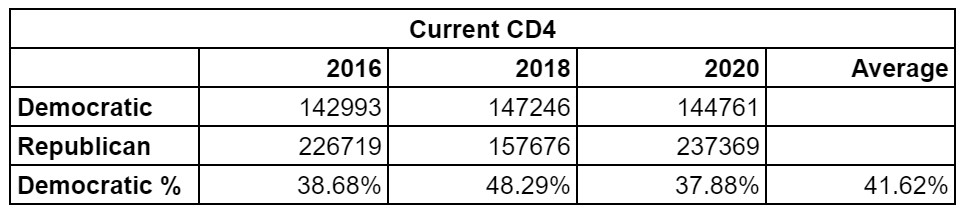
Map 1A does comes with a giant caveat: a district like this would require a very specific set of census results. The DRA tool, using 2018 population estimates, shows these counties have a total population that is 6,776 people higher than the ideal district population. That comes to 0.865 percent variance, which falls within the 1 percent range I used to determine what districts were possible.
However, we can be reasonably sure that Polk, Johnson, and Story gained population from 2018 to 2020. For this district to fall within the range of population variance that the courts allow, the census would have to find that Polk, Story, and Johnson have all been growing slower than estimated, and that the state as a whole has been growing faster.
What’s more, the total population of these six counties would have to happen to fall right within the narrow range that courts allow. A swing of even 1,000 people makes a big difference here. A district that includes Polk and Story but not Johnson, or Polk and Johnson but not Story, is more conceivable, but would be redder than the one shown in Map 1A.
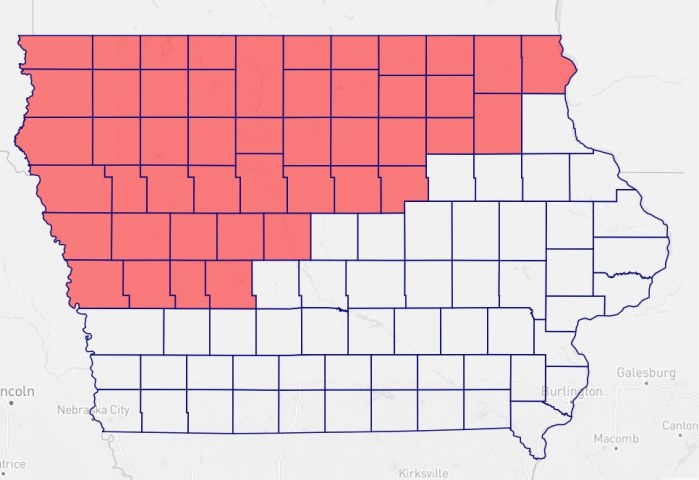
1B: Polk-Rural
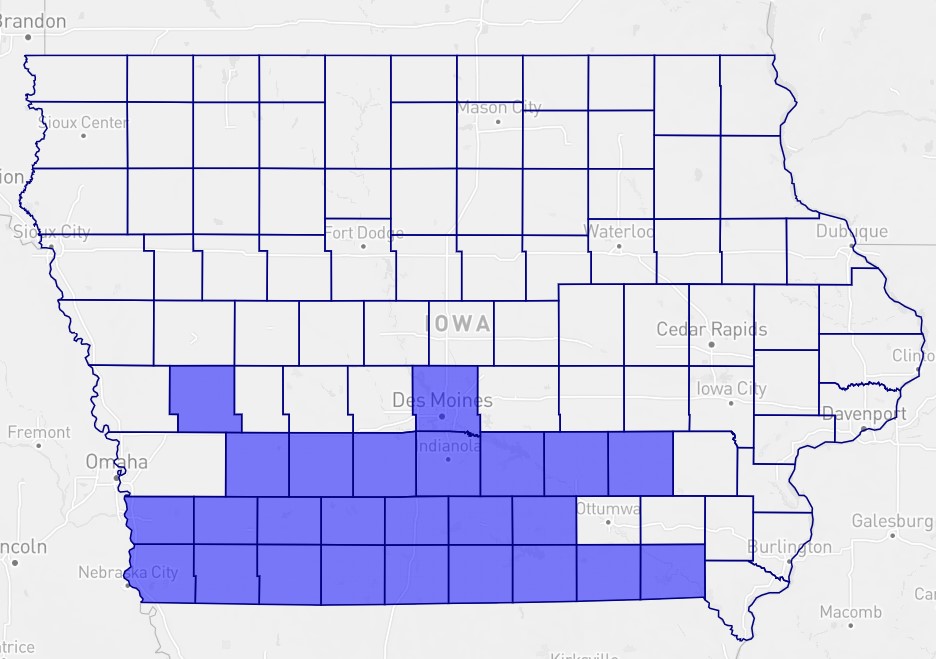
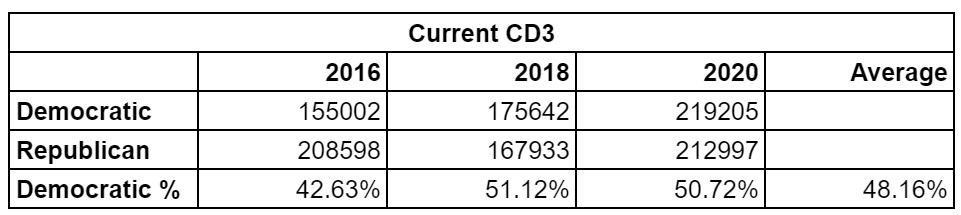
Map 1B lies on the other end of the partisan lean spectrum: this is the reddest district you can draw around Polk. This district is essentially what would happen if you removed Dallas and Pottawattamie from current CD3, and instead pulled in a few other rural counties. Here is how these counties voted in the past three congressional elections:
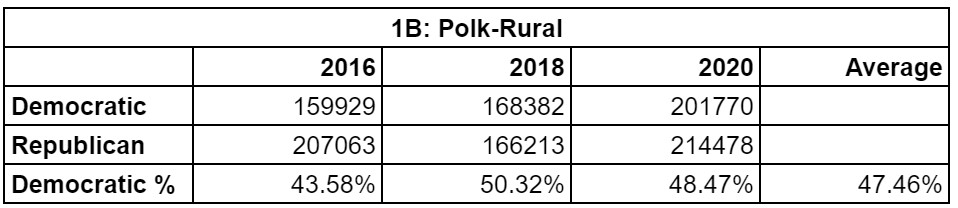
In other words, the reddest possible district that includes Polk is not much worse than the current IA-03:
While the particular configuration of counties depicted here would require a specific set of census results, there are many ways to draw Polk into a district with a bunch of rural counties. Including counties like Pottawattamie, Dallas, or Wapello makes the district bluer but only marginally so.
Polk summary
Maps 1A and 1B establish the limits of which Polk-based districts are possible: on one end, a district that is as blue as Iowa’s fourth district is red; on the other, a district that is slightly redder than the current third district.
What happens with Polk County also impacts the rest of the map. If the district is closer to Option 1A, taking three of the bluest counties in the state, the remaining districts will all be redder. For Democrats, it’s a good thing that 1A is very unlikely; one safe blue district is not worth three red-leaning districts. Option 1B is a pretty good one for Democrats: a competitive toss-up district that leaves plenty of Democratic votes for the other three districts.
Johnson County
Now let’s take a look at the People’s Republic of Johnson County. Even bluer than Polk, and more populous than Story, Johnson will have a major impact on the district it ends up in. As above, let’s start by looking at the bluest district possible that includes Johnson.
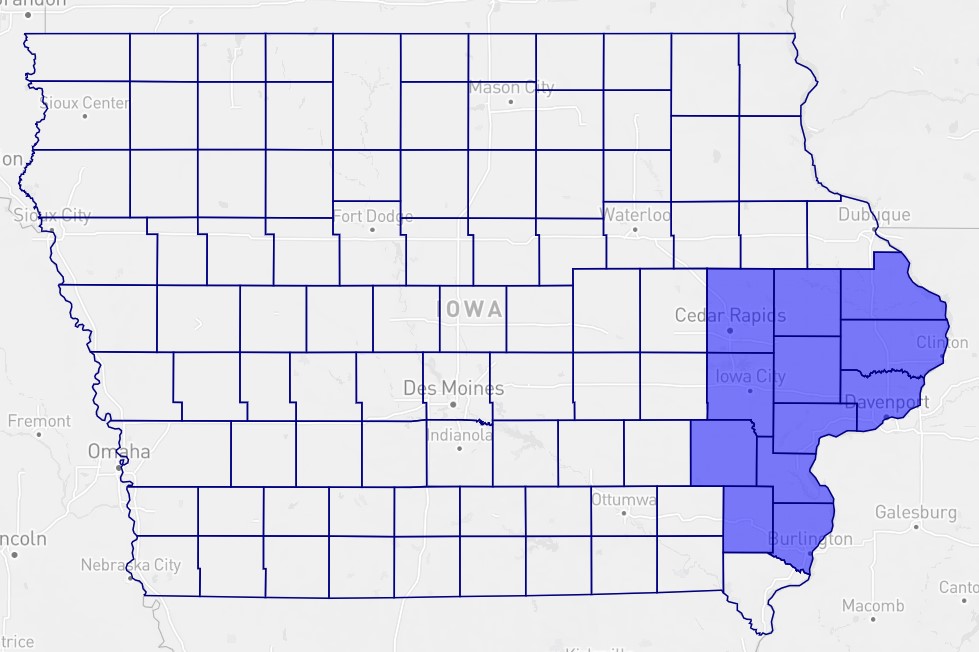
2A: Johnson-Linn-Scott-Black Hawk
This is exactly the type of district that Iowa’s perimeter measure of compactness is designed to prevent. And you can see why: this district is almost as blue as Map 1A.
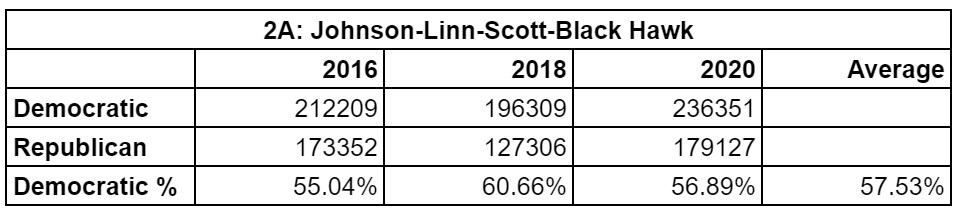
In addition to this district’s issues with compactness, population also makes it unlikely. Much like Map 1A, it would require very specific census results. But if we remove just one of the four big counties, it becomes much more likely.
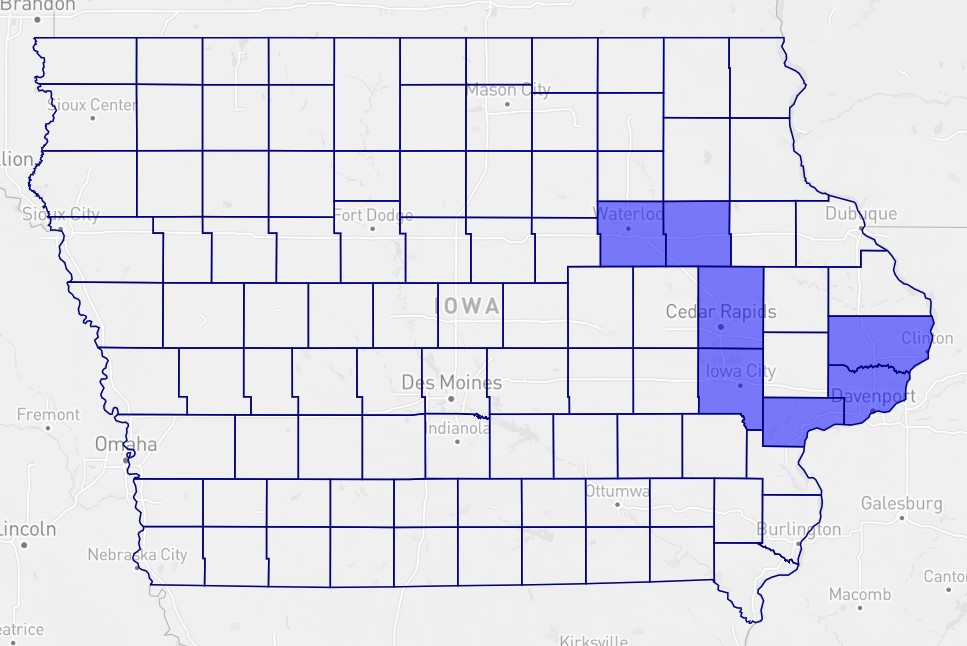
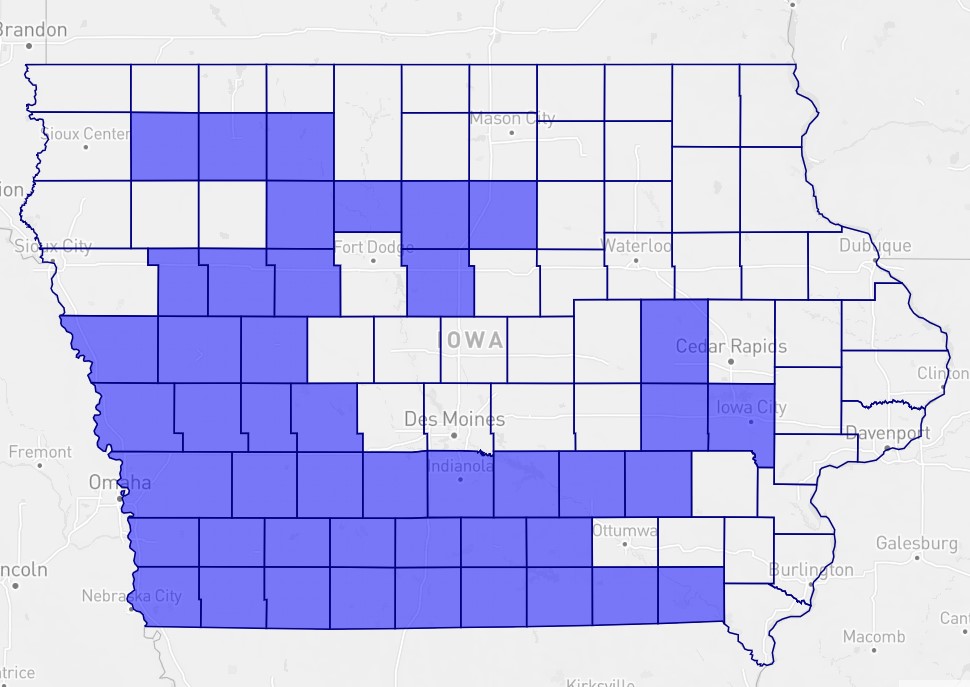
2B: Johnson-Linn-Scott-Des Moines
This district is great on both perimeter and length-width compactness, and is almost as blue as Map 2A.
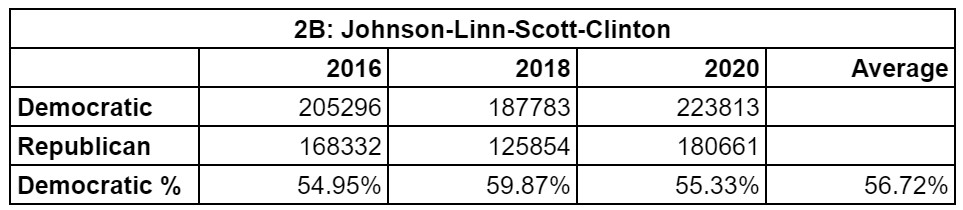
This map is also more flexible on population than Map 2A, since there are a number of ways to combine the Linn-Johnson-Scott core with a variety of blueish smaller counties, all of which result in similarly blue districts.
A district like this one wouldn’t even be the first time that Linn, Johnson, Scott, Clinton, and Muscatine were districted together – readers with long memories might recall that was the case from 1992 through 2001.
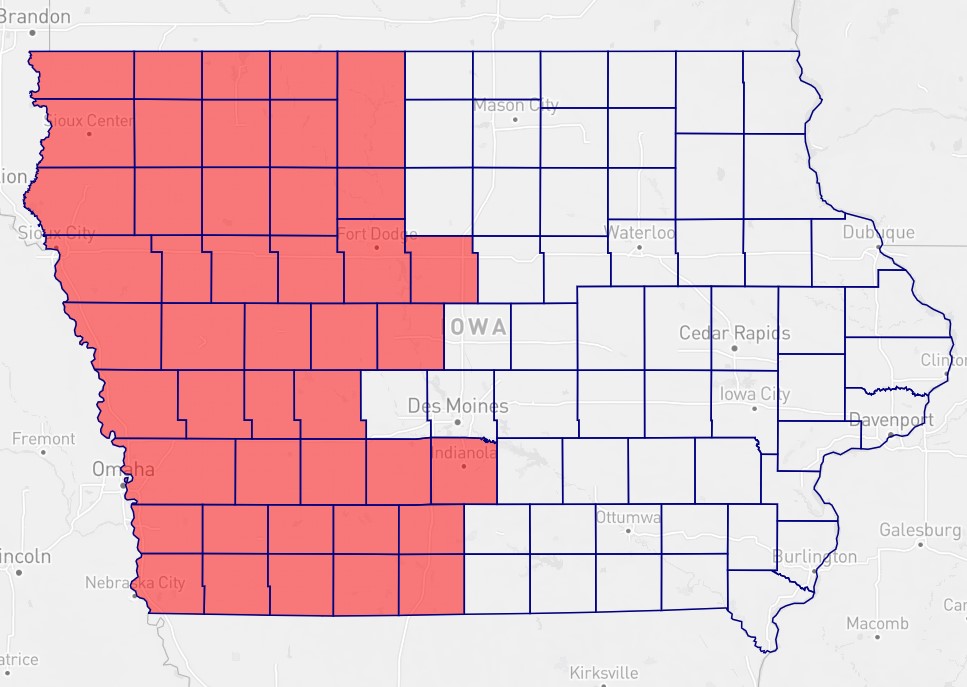
2C: Johnson-Rural
On the other end of the spectrum, this map is the reddest Johnson-based district possible.
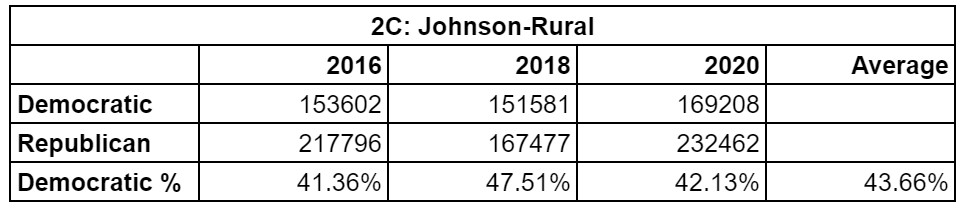
This map scores terribly on perimeter compactness (it bears a resemblance to the district that gave gerrymandering its name). But if you drop the northeastern tendrils and pick up a few more counties in the southeast instead, the district becomes more compact and still very red. So unlike Polk County, Johnson County could end up in a red-leaning district.
Johnson summary
Since Johnson is smaller than Polk, its range of possible districts is wider. The bluest option is to join forces with Linn and Scott, while the reddest option lies to the south and west. Both options are entirely conceivable but would have opposite effects on the rest of the map: 2A or 2B would make the rest of the map redder, while 2C allows the other districts to be bluer. Again, 2A or 2B wouldn’t leave many Democratic votes left for the other three districts; 2C presents the opposite problem of diluting the Johnson votes in a sea of red.
Red districts
Finally, let’s take a look at the Republican equivalents of Polk and Johnson Counties: the deep red northwest and southwest corners of the state. Plymouth and Pottawattamie, respectively, are the anchors of these two Republican strongholds. Plymouth is counterbalanced to some extent by Woodbury (containing Sioux City), but unfortunately Woodbury is neither large enough nor blue enough to outweigh its neighbors entirely.
Dealing with groups of counties rather than individual counties like Polk and Johnson leads to exponentially more district possibilities. Any county in western Iowa can be included in a blue district just by connecting it to Polk County. So instead, I will focus on the other end of the spectrum: what are the reddest ways to handle the northwest and southwest corners of the state?
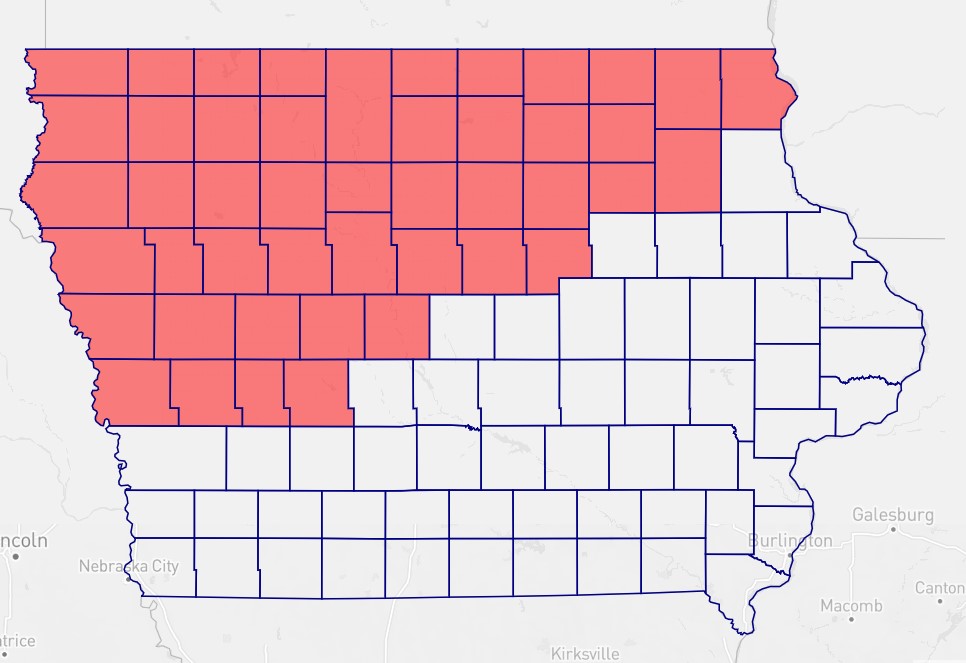
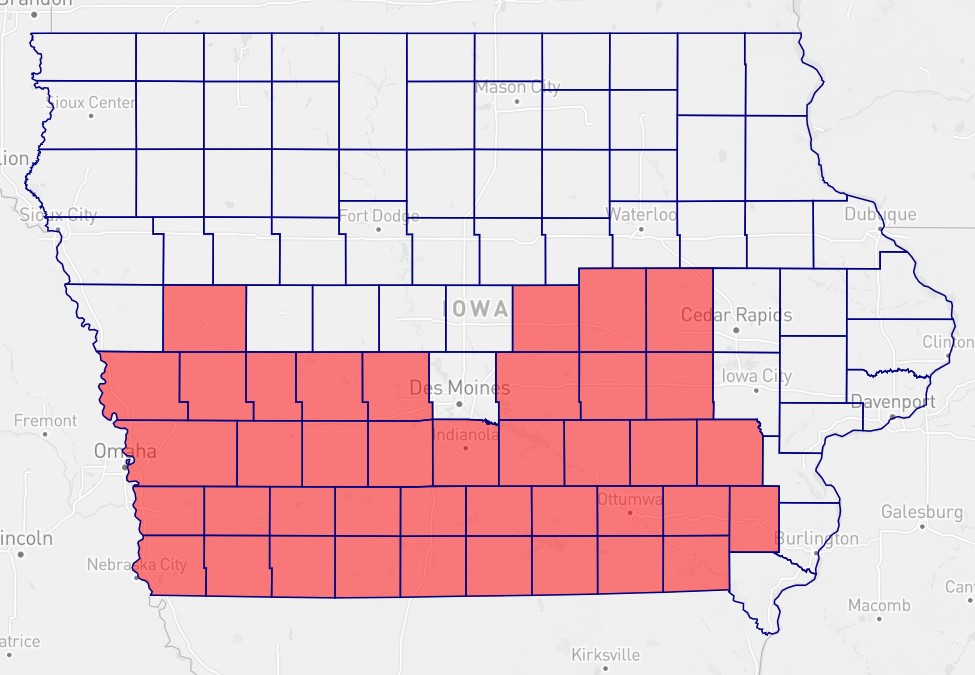
3A: Red West
The reddest option is to combine the northwest and southwest together. This district, which excludes blue Story and purple Dallas, would be an even safer Republican seat than the current fourth district.
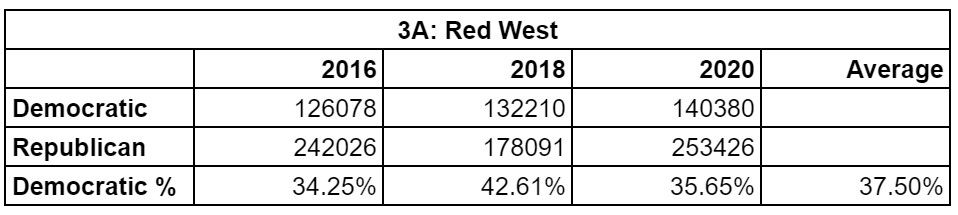
Like Map 2B, this district has historical precedent. In the 2000s, Iowa’s fifth district stretched along the western edge from the northern to the southern border. Thanks to rural depopulation, a new version of that district must now go further eastward to pick up enough population, but 3A shows that is possible to do while avoiding population centers. 3A is also a fairly compact map that allows for population variation – it would be easy to set the exact eastern border of the district based on which counties get you closest to ideal district population.
3B: Red North
Instead of heading south from the northeast cluster, you can also head all the way east to the Mississippi River. Since this district is essentially the current fourth district, but with northeastern counties instead of Story, it’s very red:
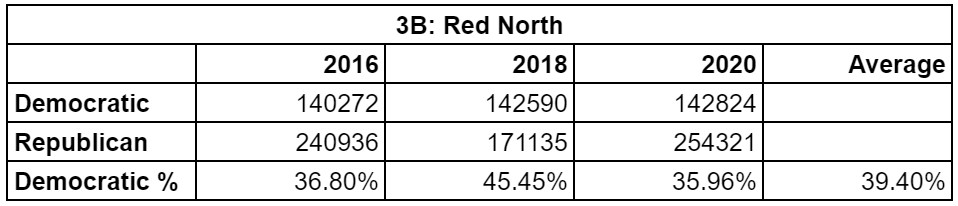
This district is entirely plausible, as it scores only slightly worse than the current IA-04 on both measures of compactness, and it allows for flexibility on population.
3C: Red South
Finally, you can ignore the northwest and instead head east from the southwest cluster. This route is a little harder because the district runs into the blueish counties in the southeast corner of the state – but as this map shows, it’s still doable.
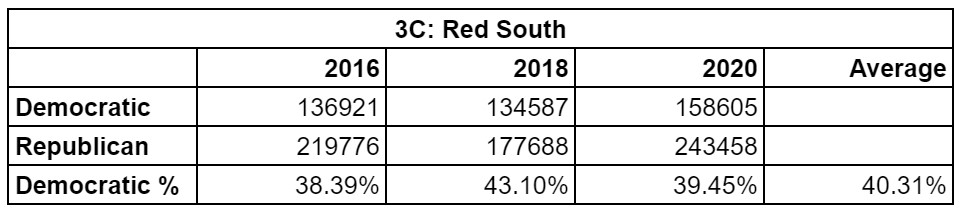
Again, this map has less flexibility due to the blue cluster of counties in the southeast, so it’s less likely than 3A or 3B. But if the census counts fall the right way, it’s very possible to draw a Pottawattamie-Dallas-Warren-Wapello district like this one.
Red districts summary
These maps show that a district even redder than the current IA-04 is possible. Right now, the district that starts in the northwest corner extends southeast as far as Story, which makes it bluer than an eastern or southern orientation would be. Similarly, the district that starts in the southwest corner has a northeast orientation, so that it picks up Polk – if it went further north or east, it could lose that blue anchor.
A map like any of the three I describe is probably bad news for Republicans. IA-04 is so red that, in 2018, Republicans were able to hold the seat even with a catastrophically bad nominee, facing an extremely strong challenger, in a blue wave year. (Disclosure: I worked for J.D. Scholten in the 2020 cycle.) Making a district even redder than the current fourth district is wasting Republican votes that otherwise would make the other three districts more competitive.
CONCLUSION
Even with all the uncertainty surrounding Iowa’s redistricting process, we do have enough data to start making predictions about what the eventual districts will look like. We know that a district as blue as IA-04 is now red is possible but unlikely, and that an even redder district in western Iowa is a real possibility. We also know that Iowa will continue to have at least one toss-up seat, since it is not possible to draw a red district around Polk.
But these eight maps are just the tip of the iceberg – for one thing, I only touched on what each of these districts would mean for the rest of the map. If you want to explore the options for a full map based on any of these districts, I highly recommend checking out Dave’s Redistricting App for yourself. I firmly believe that, as with any political process, more citizen engagement is a good thing for redistricting. And one bright side of the census delays is that we all have seven extra months to educate ourselves on the different possible districts.
One final note: as I mentioned above, all calculations of partisan lean are based on the current party coalitions. The single best way for Democrats to win Congressional seats in Iowa is not to draw favorable districts, but to improve margins in rural counties. As long as Democrats keep losing rural areas, Iowa will be a red state.
Part of the work to reverse that trend is on the policy front – building out a rural platform that goes beyond ethanol and broadband – but policy alone won’t fix the problem. A bigger part of the solution is having a meaningful presence in rural communities, perhaps through the year-round organizing efforts that new Iowa Democratic Party chair Ross Wilburn has been talking up. Democrats used to regularly win statewide elections – with a better rural platform and an actual presence in rural areas, we can do so again.