Sixth in a series interpreting the results of Iowa’s 2022 state and federal elections. This post has been updated to include numbers from the Iowa Secretary of State’s revised statewide statistical report, issued on January 27.
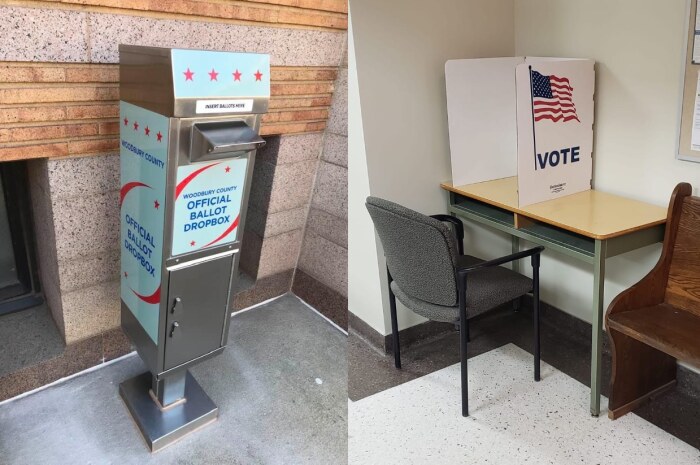
The Iowa Secretary of State’s office recently published the statewide statistical report on the 2022 general election. Republicans enacted many new barriers to early voting in 2021, which meant that compared to previous elections, Iowans had fewer days to request absentee ballots, fewer days to vote early by any means, and less time to return absentee ballots to county auditors. It was also much harder for Iowans to deliver another person’s completed absentee ballot, and each county could have only one drop box.
As expected, fewer Iowans voted early. The decline wasn’t spread evenly across the electorate.
All figures in the tables below come from statewide statistical reports available on the Secretary of State’s website. Those documents list the number of “absentee” voters in each category, directly below the “total voted” in that group. Here, “absentee” refers to all ballots cast before election day by any means: mailed ballots or early voting in person at a county auditor’s office or satellite location.
The “total voted” number on the statewide statistical report for the 2022 election (1,228,597) is slightly lower than the total votes reported on the official canvass published in December (1,230,416). Reports from previous Iowa elections have similar discrepancies, which may reflect the fact that some voters died or moved out of state between the November election and early January, when the Iowa Secretary of State’s office pulled the voter file for the statistical report.
On to the takeaways:
1. Early voting was way down compared to the last two midterm elections.
Overall turnout in November wasn’t particularly low; although about 8 percent fewer Iowans cast ballots compared to 2018 (when Iowa saw unusually high participation), turnout was still about 7 percent above the 2014 level.
In contrast, the number of Iowans who voted before election day in 2022 was way down compared to 2014 as well as 2018, both in absolute numbers and as a share of the electorate.
| 2002 | 2006 | 2010 | 2014 | 2018 | 2022 | |
|---|---|---|---|---|---|---|
| total voting | 1,021,200 | 1,044,459 | 1,125,386 | 1,135,138 | 1,329,930 | 1,228,597 |
| total voting early | 242,357 | 224,774 | 360,467 | 465,166 | 535,782 | 369,041 |
| Percent voting early | 23.7% | 21.5% | 32.0% | 41.0% | 40.3% | 30.0% |
2. Early voting dropped more sharply among Republicans than Democrats.
In all recent election cycles, Iowa Democrats have been more likely than Republicans to vote early. But the disparity was especially pronounced in 2022—probably because former President Donald Trump’s many diatribes and false claims about voter fraud have discouraged his followers from attempting to vote before election day.
| Party affiliation | 2002 | 2006 | 2010 | 2014 | 2018 | 2022 |
| Dems voting | 353,584 | 384,983 | 395,312 | 374,990 | 458,902 | 421,201 |
| Dems voting early | 116,517 | 109,862 | 155,421 | 186,269 | 228,966 | 186,316 |
| Percent Dems voting early | 33.0% | 28.5% | 39.3% | 49.7% | 49.9% | 44.2% |
| GOP voting | 412,863 | 386,382 | 447,445 | 452,283 | 492,802 | 511,622 |
| GOP voting early | 87,344 | 75,634 | 136,243 | 178,653 | 188,861 | 121,724 |
| Percent GOP voting early | 21.2% | 19.6% | 30.4% | 39.5% | 38.3% | 23.8% |
| no-party voting | 254,753 | 273,094 | 281,546 | 305,108 | 368,772 | 288,959 |
| no-party voting early | 38,496 | 39,278 | 68,499 | 99,491 | 115,057 | 59,988 |
| Percent no-party voting early | 15.1% | 14.4% | 24.3% | 32.6% | 31.2% | 20.8% |
| total voting | 1,021,200 | 1,044,459 | 1,125,386 | 1,135,138 | 1,329,930 | 1,228,597 |
| total voting early | 242,357 | 224,774 | 360,467 | 465,166 | 535,782 | 369,041 |
| Percent voting early | 23.7% | 21.5% | 32.0% | 41.0% | 40.3% | 30.0% |
Some Democrats who had voted early in the past waited until November 8 last year. Anecdotally, many were concerned mailed ballots wouldn’t make it back in time.
The Iowa Democratic Party invested far fewer resources in early GOTV compared to past election cycles, largely for lack of funds. In addition, some Democratic campaigns chose not to encourage voting by mail, for fear that too many ballots would not be counted due to the new restrictions.
Iowa Starting Line’s Pat Rynard analyzed the return rate for absentee ballots and found that contrary to expectations, it was slightly higher for Democrats in 2022 than in past years. He concluded, “Democrats would be unwise to abandon sweeping vote-by-mail efforts in the future,” since that method remains “a highly effective way to turn out voters” who might otherwise skip the election.
On the Republican side, early voting dropped by a third, even though overall participation was up compared to 2018. In terms of raw votes, Iowa GOP turnout last year was the highest in a generation. (As a percentage of registered Republicans, turnout was slightly below the 2018 level.) But the GOP didn’t invest as much in early GOTV, compared to the Terry Branstad days.
Voters affiliated with no party have lower overall turnout rates for midterm elections than do Democrats or Republicans, and they are also less likely to vote before election day. In addition to being less politically engaged, they also are less likely to be targeted by the parties’ GOTV, such as absentee ballot request form mailings or canvassing.
3. The oldest Iowans are still the most likely to vote early.
Senior citizens are Iowa’s most reliable voters by far and tend to vote early in larger numbers. Voting by mail is vital for many Iowans who reside in assisted living facilities or cannot drive themselves to the polls.
Although fewer than half of Iowa voters over age 65 cast early ballots last year (unlike in 2014 and 2018), they still had a much higher percentage of early voters than any other age cohort.
| Age group | 2002 | 2006 | 2010 | 2014 | 2018 | 2022 |
|---|---|---|---|---|---|---|
| 18-24 voting | 48,811 | 51,776 | 59,861 | 56,020 | 93,808 | 71,667 |
| 18-24 voting early | 15,415 | 13,187 | 21,262 | 21,006 | 31,179 | 14,216 |
| Percent 18-24 voting early | 31.6% | 25.5% | 35.5% | 37.5% | 33.2% | 19.8% |
| 25-34 voting | 98,724 | 101,015 | 199,510 | 118,679 | 158,049 | 129,650 |
| 25-34 voting early | 17,492 | 14,543 | 25,293 | 35,395 | 47,142 | 22,430 |
| Percent 25-34 voting early | 17.7% | 14.4% | 21.2% | 29.8% | 29.8% | 17.3% |
| 35-49 voting | 299,644 | 275,648 | 257,406 | 234,020 | 286,080 | 266,797 |
| 35-49 voting early | 49,395 | 36,994 | 54,152 | 67,165 | 85,217 | 48,478 |
| Percent 35-49 voting early | 16.5% | 13.4% | 21.0% | 28.7% | 29.8% | 18.2% |
| 50-64 voting | 296,631 | 334,672 | 378,349 | 379,881 | 391,837 | 340,846 |
| 50-64 voting early | 66,009 | 68,088 | 117,679 | 152,667 | 155,955 | 92,262 |
| Percent 50-64 voting early | 22.3% | 20.3% | 31.1% | 40.2% | 39.8% | 27.1% |
| Over 65 voting | 277,390 | 281,346 | 310,259 | 346,538 | 400,156 | 419,637 |
| Over 65 voting early | 94,046 | 91,962 | 142,081 | 188,933 | 216,289 | 191,655 |
| Percent over 65 voting early | 33.9% | 32.7% | 45.8% | 54.5% | 54.1% | 45.7% |
| total voting | 1,021,200 | 1,044,459 | 1,125,386 | 1,135,138 | 1,329,930 | 1,228,597 |
| total voting early | 242,357 | 224,774 | 360,467 | 465,166 | 535,782 | 369,041 |
| Percent voting early | 23.7% | 21.5% | 32.0% | 41.0% | 40.3% | 30.0% |
4. Iowa women are still more likely than men to vote early.
Iowa women have long been more willing to vote early, in presidential elections as well as midterms. One obvious explanation is related to the political gender gap: women are more likely than men to be Democrats.
I believe family obligations also help explain this disparity. An unexpected obstacle to making it to the polling place is more likely to impede a primary caregiver to children or older relatives, giving women more reason to bank their votes ahead of time.
| Gender | 2002 | 2006 | 2010 | 2014 | 2018 | 2022 |
|---|---|---|---|---|---|---|
| Women voting | 541,145 | 552,260 | 587,561 | 593,649 | 697,349 | 632,645 |
| Women voting early | 140,091 | 127,737 | 201,638 | 258,804 | 297,602 | 202,335 |
| Percent women voting early | 25.9% | 23.1% | 34.3% | 43.6% | 42.7% | 32.0% |
| Men voting | 480,036 | 492,198 | 537,824 | 541,489 | 632,581 | 595,952 |
| Men voting early | 102,258 | 97,037 | 158,829 | 206,362 | 238,180 | 166,706 |
| Percent men voting early | 21.3% | 19.7% | 29.5% | 38.1% | 37.7% | 28.0% |
| total voting | 1,021,200 | 1,044,459 | 1,125,386 | 1,135,138 | 1,329,930 | 1,228,597 |
| total voting early | 242,357 | 224,774 | 360,467 | 465,166 | 535,782 | 369,041 |
| Percent voting early | 23.7% | 21.5% | 32.0% | 41.0% | 40.3% | 30.0% |