Macklin Scheldrup was the Iowa Democratic Party’s Data Director in 2022. A native of Cedar Rapids, he had previously worked on the monitoring and evaluation of foreign aid projects in conflict zones including Afghanistan, Pakistan, and South Sudan.
Part 1 of this series tried to ascertain the percentage of Iowa’s 2022 general electorate who could be classified as swing voters by the rate of ticket-splitting. It found evidence that ticket-splitting is comparatively high in Iowa and has not declined over the past few decades, with at least 12.4 percent of 2022 voters splitting their ticket.
So where are these voters located? And what can that tell us about why they are willing to vote for candidates from either major party in the same election?
The ticket-splitting score presented in Part 1 can also be calculated for smaller areas of Iowa.
To do so at the state House district level, I calculated the average statewide two-party margin within each district, then calculated and averaged the absolute difference between that mean partisanship and the two-party margin of each of the seven statewide races on the 2022 ballot.
Looking at ticket-splitting by Iowa House district in the map below, there is no obvious pattern by district demographics around ticket-splitting. The most “elastic” districts, or areas with the most statewide ticket-splitting, are more rural as well as exurban, older, Republican-leaning, and include some heavily Hispanic areas.
However, those correlations aren’t uniform across the state. Some rural and exurban areas had some of the lowest levels of ticket-splitting in the state. Other GOP-leaning House districts had very low ticket-splitting as well, as the state’s most Republican House districts in northwest Iowa also witnessed relatively low levels of ticket-splitting.

Instead, ticket-splitting appears to have been a peculiarly regional phenomenon. A “ticket-splitting belt” extends vertically across west-central Iowa before moving east towards northeast Iowa. That highest ticket-splitting scores are all in the west-central Iowa line from Storm Lake and Spencer-based House district 6 (12.6 percent) down through House district 7 (12.9 percent), House district 47 including Guthrie County and Perry (12.9 percent), and into House district 23 (12.6 percent) which includes Winterset and Greenfield.
The only other Iowa House districts with ticket-splitting scores above 12 were north and east of the Waterloo area: House district 68 (12.6 percent, Fayette County to Jesup) and House district 58 (12.1 percent, Charles City and New Hampton).
The least elastic state house districts were all in or around Council Bluffs: House district 20 (2.0 percent), House district 19 (2.5 percent), and House district 15 (2.9 percent, rural Pottawattamie into Harrison County). There was also relatively little ticket-splitting in heavily Democratic House districts of Iowa City, namely House district 89 (2.9 percent) and House district 90 (3.3 percent).
The prototypical swing voter is often described as a college-educated suburbanite. But 2022 ticket-splitting in Iowa doesn’t support that characterization. Some suburban House districts did witness fairly high levels of ticket-splitting, such as Johnston-based House district 43 (11.1 percent) and Altoona-dominated House district 40 (11.2 percent).
However, many others had almost no ticket-splitting, including Coralville’s House district 86 (4.2 percent) as well as House district 93 (4.3 percent) and House district 94 (4.6 percent), which split Bettendorf and include other suburban areas of the Quad Cities.
By county, the highest rates of ticket-splitting occurred in Chickasaw (15.4 percentage point average deviation from mean), Adair (15.0 percent), Greene (14.7 percent), and Ringgold (14.1 percent) counties. The counties that had the least amount of ticket-splitting this election were on the Missouri River, with the four lowest scores in Pottawattamie (2.6 percent), Lyon (2.9 percent), Mills (3.0 percent), and Harrison (3.4 percent) counties.
There were also low levels of ticket-splitting for statewide candidates along the Mississippi River, namely Lee (3.8 percent) and Scott (4.2 percent) counties.

Overall, the most elastic areas of the state are all rural to exurban locations stretching across the south, west, and north limits of the Des Moines media market into the northeast corner of the state. The same broad pattern was also present when looking at results from the 2018 and 2020 elections.
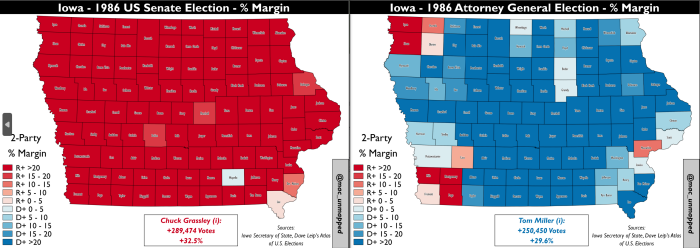
That trend also appears to be long-standing. The 1986 midterm elections were interesting for a number of reasons. Not only was it Terry Branstad’s closest ever gubernatorial win, but it also featured the last stand-alone election for lieutenant governor, won by Democrat Jo Ann Zimmerman. In total, Democrats won five statewide races and Republicans won four. While ticket-splitting was higher across the state, the comparative levels by county were very similar to 2022; highest in rural central Iowa and lowest in large cities along the Mississippi and Missouri Rivers.
A correlation of county-level statewide ticket-splitting between the 1986 and 2022 elections produces a coefficient of 0.66 and a p-value of 0.00, indicating a strong and statistically significant positive relationship between the two.

Why do these rural counties have such a propensity for ticket-splitting, while other rural areas of the state with similar partisanship and demographics don’t do so nearly as often? The question should be explored more in the future. But it’s worth noting that of the 53 counties with a 2022 elasticity score of 9.5 or higher, every single one is in the Des Moines, Cedar Rapids, or Sioux City media markets. Those three markets are the only ones with more than two-thirds of viewers living in Iowa.
There are two plausible explanations for this phenomenon. The first is related to ad-buy decisions between campaigns across different markets. Campaigns with less money available might focus exclusively on larger markets, leaving voters in peripheral media markets with less ability to differentiate between candidates of the same party.
Another factor could be differences in news coverage between media markets with a majority of viewers in Iowa, compared to those with more out-of-state viewers. According to this hypothesis, voters in markets dominated by Iowa coverage are defining candidates outside of the party label at higher rates.
Because the pattern extends across multiple election cycles with different spending decisions, I’m inclined to put more weight on the latter explanation. When local news coverage is focusing on Iowa state government and politics, candidates have a better ability to gain the support of voters who would not normally support their respective political party. Obtaining campaign ad-buy amounts by media market for past elections would help to test the explanatory power of the other theory of change.
Unfortunately, the Iowa Secretary of State’s Office has yet to publicly produce a statewide precinct shapefile following the decennial reprecincting. (Iowa is of the only states yet to do so.)
Fortunately, many county auditors have filled the void with their own files to allow for mapping by precinct. The map below presents the 2022 ticket-splitting propensity score by precinct across four central Iowa counties.

The lowest levels of ticket-splitting were in the heart of urban Des Moines, namely the heavily Democratic precincts in and around Downtown as well as majority-minority precincts just north of I-235. The DSM-30 precinct (bounded by I-235, Martin Luther King Parkway, Forest Ave, and the Des Moines River) had a ticket-splitting score of just 2.05 percent.
There were also relatively low levels of ticket-splitting in higher-income precincts across the west side of Des Moines and into newly developed areas of Dallas County. Not a single Waukee precinct had a ticket-splitting score above 9.25 percent. This particular high-growth suburban area did not have a large percentage of swing voters in 2022.
The same can be said for certain Ankeny precincts, but not others (scores ranged from 7.7 percent to 12 percent). The pattern in that booming city was not clear. But in nearby Urbandale and Johnston, precincts were much more likely to have high levels of ticket-splitting (eight precincts in those cities had scores above 11 percent).
At the same time, voters in Norwalk and other suburban Warren County precincts also split their tickets at very high rates. The fastest growing areas of the Des Moines metro were not telling the same story when it comes to ticket-splitting.
Consistently, the highest levels of ticket-splitting in Polk County were along the east side of the metro extending from Pleasant Hill through Altoona and the unincorporated precincts surrounding them. Similarly, the precincts in Des Moines proper with the greatest levels of ticket-splitting were nearby on the diverse northeast side of the city. Overall this working-class, less college-educated part of the metro not only saw the greatest level of 2022 ticket-splitting, but also some of the largest swings in the state from Fred Hubbell in 2018 to Donald Trump two years later.
Madison County is also home to a large proportion of swing voters; every single precinct produced a ticket-splitting score of at least 11 percent, with a score of 14.6 percent for the precinct that includes the town of Earlham.
Looking at eastern Iowa, the divide between media markets is evident. Among the three Quad Cities market counties of Scott, Clinton, and Muscatine, only a single precinct had a ticket-splitting score above the statewide average of 8.4 percent. In fact, only two Scott County precincts had ticket-splitting at a figure greater than 7 percent.

Not a single Davenport precinct (0 percent) and only two Bettendorf precincts (13 percent) had ticket-splitting scores above 5 percent. In demographically similar Cedar Rapids, 39 precincts (77 percent) met this mark, while in Marion another 16 precincts (89 percent) did so. Most of Iowa City and Coralville were also below this level of ticket-splitting, but those rates increased in North Liberty, Tiffin, and other rural parts of Johnson County.
Within Linn County, the highest rates of ticket-splitting were in the unincorporated townships just outside of metro city limits. These included the Marion, Monroe, Clinton, and Fairfax townships, where every precinct had at least a 9.9 percent ticket-splitting score. There were also relatively high levels of ticket-splitting across the northeast and northwest sides of Cedar Rapids as well as Marion and Robins.
Jones County had a high rate of ticket-splitting in both small towns and rural precincts. Every single precinct in Monticello and Amana, as well as five rural precincts, had ticket-splitting scores above 9 percent.
Stepping back, what does all this information tell us about swing voters in Iowa? It appears that they are less likely to live in an urban core and also don’t reside next to a major university. But beyond that, it seems that idiosyncratic local conditions and the local news and information a voter has access to are more likely than demographics to determine whether Iowans vote straight-ticket or split their political allegiance between parties.
That conclusion implies that areas’ ticket-splitting propensity is more or less ingrained into their political preferences. Reaching voters with a history of ticket-splitting would then be a more effective strategy than attempting to create new swing voters.
Whether or not this analysis is correct, the discussion is important, because the large number of swing voters in Iowa will determine future election outcomes.
4 Comments
excellent data and research
Thanks for putting this together. As i mentioned earlier I have split my ticket a few times since 1976. Voted Libertarian for governor this past time and don’t plan to vote for Biden again under any circumstances. He’s mentally and physically challenged to say the very least. He and Feinstein are pitiful. Only a fool (or a sycophant) votes straight ticket every time.
HHHdemocrat Mon 5 Jun 10:50 PM
Rural counties with a Catholic church
Thanks for these great articles and deep analysis. I’m willing to bet there is a correlation between rural counties that had a Catholic church and high swing voting. In my experience, if a rural county has had a relatively high percent of Catholics (bingo players and beer drinkers) long enough ago to have built a church, the attitudes (towards the Community and towards their neighbors) are a little different than Protestants (teetotalers and hypocrites). That is not to say the teachings of a religion makes the difference. A community with roots in Catholic, working class still have voters that see some GOP candidates as the same hypocrites they didn’t like in high school. To be clear, I don’t think Protestants are hypocrites but they are more accepting of hypocrisy.
miketram01 Tue 6 Jun 7:54 AM
Greene County
The County Attorney for Greene County is a Libertarian; as far as I know he has always run unopposed. If a registered R or D voted for him, would this be considered ticket-splitting? I do not think either party is interested in replacing him.
David Weaver Thu 8 Jun 7:26 AM
This post represents a LOT of time, work, and thinking...
…and I am grateful to Macklin Scheldrup. Very interesting. Thank you!
PrairieFan Thu 8 Jun 5:19 PM