
Dan Guild surveys the possibilities for control of the U.S. House. In his last Bleeding Heartland post, he reviewed generic ballot polling and swings in special elections. -promoted by desmoinesdem
When tidal waves hit, and when we know they are coming
Nothing is more human than the tendency to underestimate how much things change. Few predicted the collapse of the Soviet Union. Though there were signs, most did not anticipate how badly the U.S. and global economies would be hit by the U.S. mortgage crisis.
Anyone who remembers election night 2016 knows well how poorly humans are able to predict politics. In the time I have been active I have seen the same mistake over and over: people underestimate the range of possible outcomes.
This is particularly true when it comes to the U.S. House of Representatives. The vast majority of this year’s House races have not been polled yet. My database has 41 House polls, most of which were commissioned by campaigns or the Democratic Congressional Campaign Committee.
2018 is not unusual in this regard. So it isn’t really surprising that if we go back and look at how well humans have predicted elections at this point in the cycle, we find they underestimate the range in outcomes.
The table below shows the Labor Day predictions by two of best political forecasters: Cook Political Report and Sabato’s Crystal Ball. The Cook report data is based on my own calculations of data presented by Professor James E. Campbell. The Crystal Ball calculations are my own, based on spreadsheets I received from Kyle Kondik, the site’s managing editor.
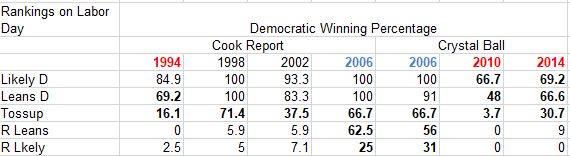
To be clear, this isn’t an attack on either Cook or Crystal Ball. I have followed both for years, and they as good a source for objective analysis of politics as exists. To repeat: these tables are for predictions on Labor Day. Both Cook and Crystal Ball’s predictions are much more accurate (indeed astonishingly accurate) the day before an election.
1994, 2006, 2010 and 2014 were “wave elections.” In wave years, seats that were thought to be toss-ups tend to be won by one party. After all, if toss-ups were really 50-50 propositions, we would expect to see them split roughly equally. But they did not split evenly in 1994, 2006, 2010, or 2014.
Waves share another characteristic: seats where one party is thought to have an advantage are lost as well. In 1994 Republicans won 30 percent of the Lean Democratic seats and 15 percent of the seats that were rated likely Democratic. In 2006, Democrats won 62.5 percent of the leaning Republican seats and 25 percent of the seats rated likely Republican. By the same token, in 2010 and 2014 Republicans won more than 30 percent of seats rated likely Democratic or leans Democratic.
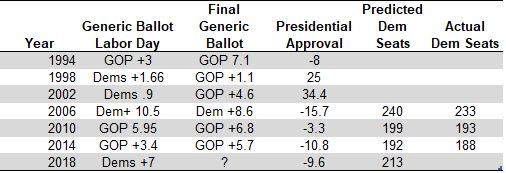
Can we predict waves? Not always. At this point in 1994 the data didn’t show the landslide to come. President Bill Clinton’s favorability was not terrible, and the generic polling did not predict a GOP wave.
Conversely, in 2006, 2010 and 2014 there were signs of a wave in the generic ballot, which is reflected in the projection. This prediction is a rather simple model, based on the prior House results and the generic ballot. (I do not have predictions for years prior to 2006.)
Top image: By Misty (originally posted to Flickr as The tube) [CC BY 2.0 (https://creativecommons.org/licenses/by/2.0)], via Wikimedia Commons