
Midwestern states continue to have greater “racial disparities in economic opportunity and economic outcomes” than do other regions of the U.S., while “policy interventions designed to close those gaps are meager,” concludes a new report by Colin Gordon of the University of Iowa and the Iowa Policy Project.
Gordon’s findings are consistent with past research showing that African Americans in Iowa face pervasive barriers in many areas of life. By some measures, our state’s racial disparities are among the worst in the Midwest region and the country.
The Iowa Policy Project, Policy Matters Ohio, COWS, and the Economic Analysis and Research Network supported the project, which the Economic Policy Institute published this past week as Race in the Heartland: Equity, Opportunity, and Public Policy in the Midwest. Gordon analyzed a range of factors in twelve states (North Dakota, South Dakota, Minnesota, Wisconsin, Iowa, Illinois, Nebraska, Michigan, Missouri, Kansas, Ohio, and Indiana). I recommend reading and downloading his whole report.
The findings summarized below won’t surprise anyone familiar with the comprehensive 2017 report on The State of Black Polk County, or the annual assessments by 24/7 Wall Street. Midwestern metro areas have regularly dominated that website’s lists of “Worst Cities for Black Americans.”
A few words about the methods Gordon used to measure racial disparities:
Here we examine not just conventional economic outcomes (wages, incomes, poverty rates), but other dimensions of economic opportunity and security such as education and homeownership. For each of these metrics, we have calculated state-level racial disparities as the gap and the ratio between black and white levels or rates. For a state whose unemployment rates are 5 percent for whites and 15 percent for black people, for example, the gap would be 10 percent and the ratio would be 3:1 (black people are three times more likely to be unemployed). Both are important measures: the gap captures the absolute levels, and the ratio captures the relative positions. At unemployment rates of 15 percent white and 20 percent black, for example, the levels are high for both groups, but the ratio or disparity between the two is smaller.
HIGHLY SEGREGATED CITIES
Gordon notes that the two biggest factors shaping “patterns of racial disparity and race relations in the Midwest” are racial segregation and uneven economic opportunities. “[I]n every census year since 1890, large cities of the Midwest are more segregated—when we measure the concentration and isolation of their black population–than those of any other region.”
Furthermore, “Patterns of racial segregation extend into smaller metros throughout the region, which are more segregated than similar settings in other regions.18 And they extend into schools which, in most of these settings, are significantly more segregated—by race and income– than the municipalities in which they are located.19”
The State of Black Polk County report found that most African Americans in Iowa’s largest county live in ten census tracts often known as the “urban core.” Although certain segregationist practices like redlining and restrictive covenants no longer exist as a matter of law, their legacy is apparent.
Over time, many of the public policies and private practices that lay behind these patterns of segregation fell to equal-protection legal challenges, but the patterns themselves persisted.22 Some of those policies and practices, including local land-use zoning and discrimination in realty and credit markets, are still very much with us.23 Once established, racial segregation and the assumptions it carries about good neighborhoods and bad, about who belongs where, have proven hard to shake.24 The racial wealth gap, a product of segregation, also serves to further it by ensuring uneven access to homeownership, steeper costs and lesser returns for African American homeowners.25 And the consequence of all of this is not just who gets to live where. Constraints on housing and neighborhood choice lead to a cascade of disadvantages in schooling, employment, health, safety, and mobility.26
The loss of manufacturing jobs in the Midwest disproportionately affected African Americans, because ” black workers relied heavily on industrial employment, but were also precariously positioned in postwar labor markets.” Also, the loss of union jobs meant fewer black workers could benefit from “collective bargaining to overcome other forms of discrimination and disadvantage.”
Housing segregation compounded the economic disparities.
While some manufacturing jobs were lost to regional or international competition, many simply left the central city for the suburbs. Between 1970 and 1980, for example, Chicago lost 118,860 blue collar jobs while its suburbs added 237,900, Cleveland lost 42,700 while its suburbs added 97,060; and Detroit lost 104,860 and its suburbs added 186,920.33 Some industries, such as meatpacking, fled urban locations for rural outposts—trading a unionized workforce of whites and African-Americans for a non-union, low-wage and largely immigrant workforce.34
The result, as William Julius Wilson and others have underscored, is a crippling setting in which capital and employment were mobile but black workers were not.35 The black working class, especially where job losses have been steep and segregation persistent, became “trapped,” “truly disadvantaged” or “stuck in place.”36
RACIAL DISPARITIES IN EDUCATION
Gordon examined available data on educational “achievement, exclusion, and attainment.” In terms of eighth-grade assessment of proficiency in math, “all but two Midwestern states (Indiana and Missouri) fall into the bottom half of the distribution, and four (WI, ND, MN, OH) make up the bottom of the list.” Iowa was closer to the middle of the pack.
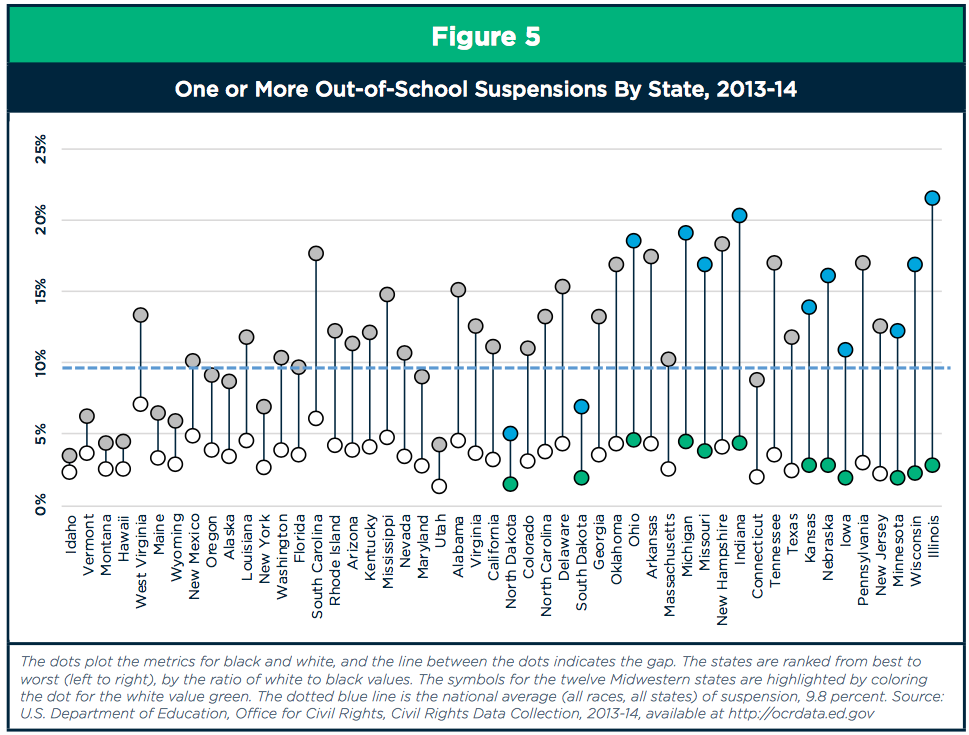
However, Iowa was sixth from the bottom for racial disparities in out-of-school suspensions.
Nationally, this disparity is stark: African American students (13.5 percent) are suspended at about four times the rate of white students (3.4 percent). In the Midwest, North and South Dakota are the only settings that don’t perform worse than this national rate. Six Midwestern states (IL, WI, MN, IA, NE, KS), all suspending black students at more than five times the rate of white students, crowd the bottom ten. The consequences of such patterns are well documented. In the short run, they undermine educational achievement and attainment.42 In the long run, they undercut economic opportunity and civic engagement, and feed the “school to prison” pipeline.43
The gap between black and white adults over age 25 who have a college degree or higher level of education is comparable in Iowa to the national average.
RACIAL DISPARITIES IN EMPLOYMENT
Gordon explained,
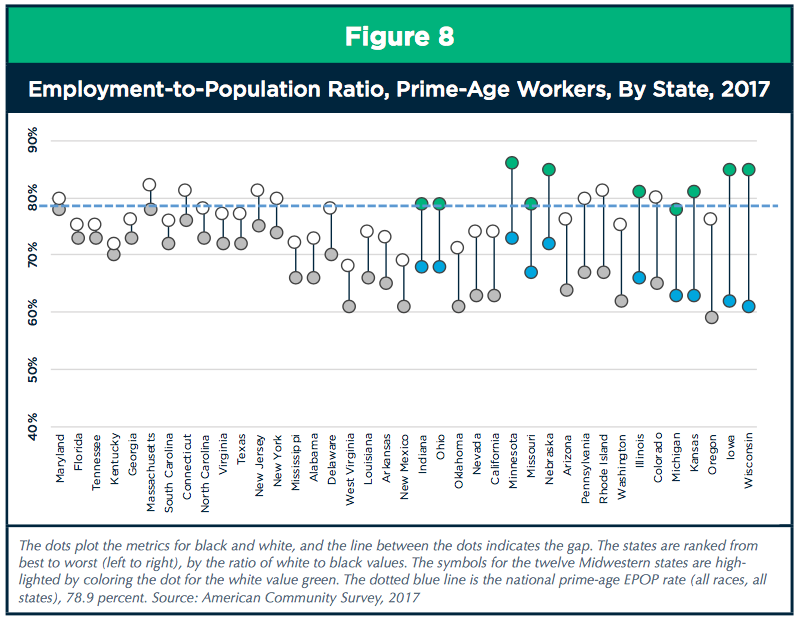
To assess racial disparities in employment, we use two measures: the employment-to-population ratio, and the unemployment rate. The employment-to- population (EPOP) ratio is simply the share of the prime-age (25-54) working population with a job. This is a good, basic measure of engagement with the labor market, sidestepping the finer distinctions (working, working part-time, looking for work) that go into the unemployment rate and minimizing the impact of schooling (for younger workers) and retirement (for older workers).48
Iowa is second from the bottom, with only Wisconsin faring worse on this metric. Note the cluster of Midwestern states near the right, indicating larger racial disparities.
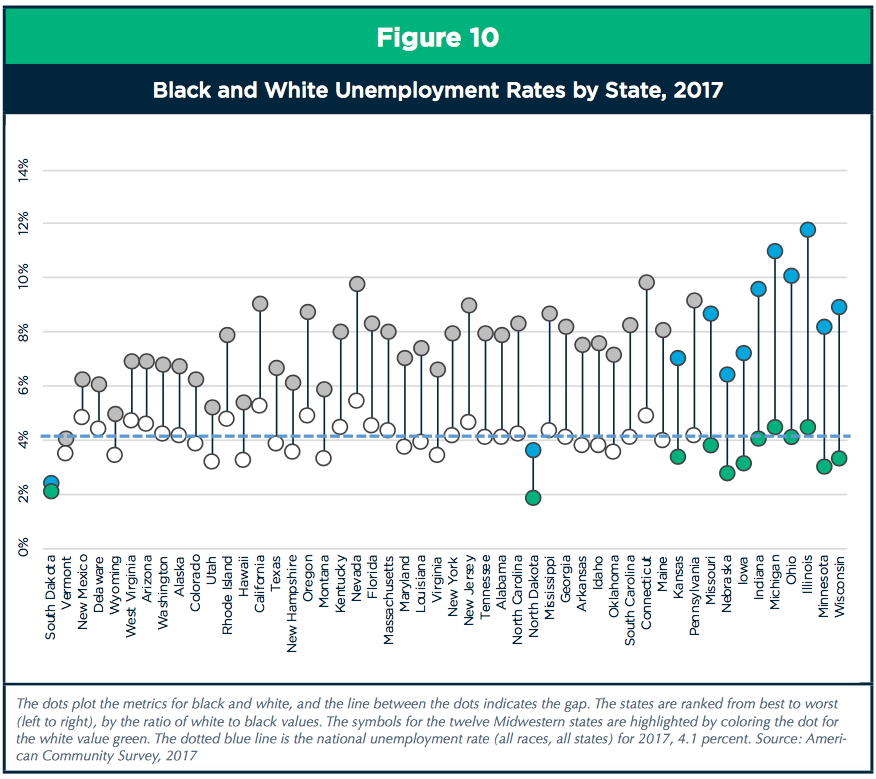
Two trends are noticeable in the unemployment rate over time: “When there is a recession, black unemployment soars more rapidly; during recovery, black unemployment improves more quickly. With the exception of the Dakotas, where the shale oil boom has dampened unemployment, there is a marked racial disparity across the Midwest.” Again, note the cluster of Midwestern states near the right. Iowa is seventh from the bottom.
RACIAL DISPARITIES IN INCOME, POVERTY RATES
Gordon found,
In the early 1980s, before the ravages of deindustrialization and union decline took hold, the black median [wage] in the Midwest was very nearly on par with the white median [wage]; by 2018, it had fallen to just 75 percent of the region’s white median. Median wages for white ($19.99) and black ($14.93) workers in 2018 were lower than those in any other census region.
Low wages, coupled with higher unemployment and lower rates of labor market engagement, create marked racial disparities in median household income.
In fact, “of the fourteen states with widest ratio of white to black incomes, nine (MN, ND, WI, IA, NE, Il, OH, SD, MI) are in the Midwest.”
Poverty rates tell a similar story.
Nationally, the black poverty rate in 2017 was 21.2 percent, almost double the white rate of 10.7 percent.54 In just four Midwestern states (MO, OH, IN, MI) does the white poverty rate exceed the national average; in every Midwestern state, the black poverty rate is greater than the national average (Figure 13). Ranked by the ratio between white and black poverty, six (MN, WI, ND, IA, IL, NE) of the seven worst-performing states are in the Midwest.
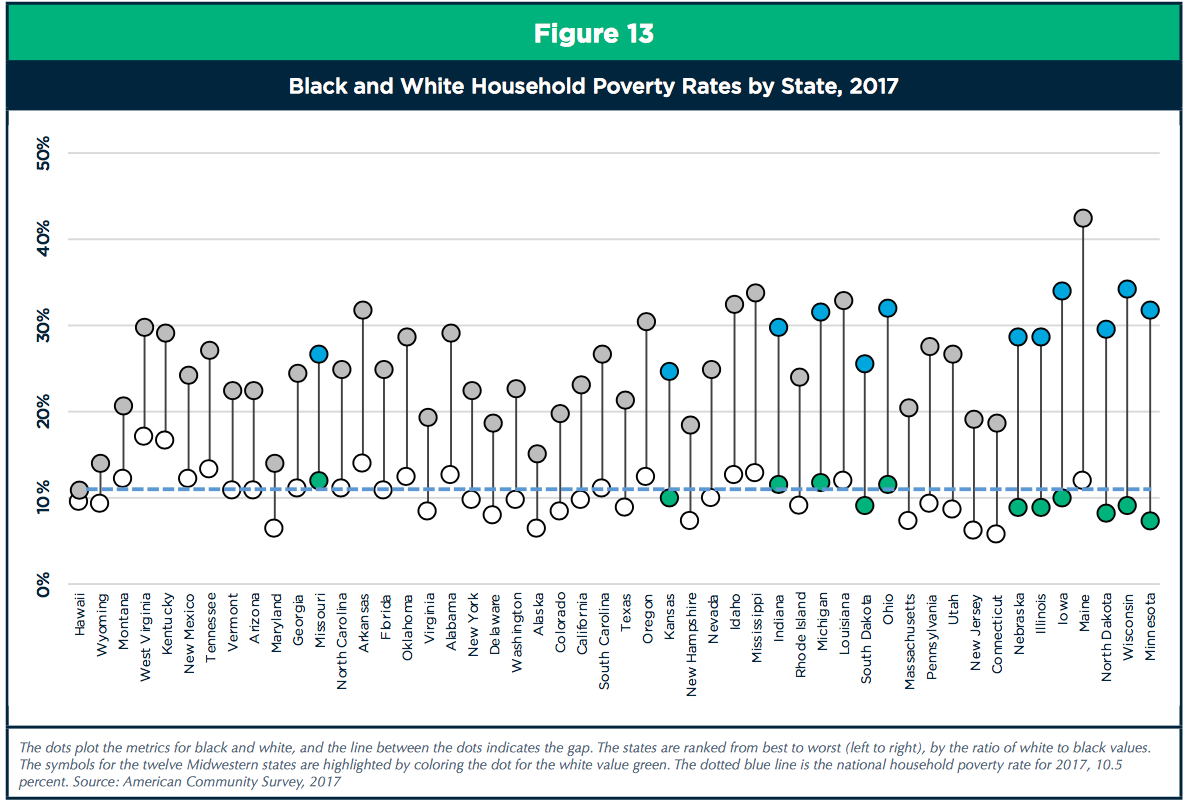
Iowa is fifth from the bottom.
RACIAL DISPARITIES IN HOUSING
The State of Black Polk County described in detail some “systemic obstacles” for African American home ownership. For example, limited access to banking makes it hard to obtain mortgages or home equity loans. That phenomenon extends far beyond Iowa’s largest county.
While the median and average cost of housing is lower in the Midwest than in other regions,57 persistent income disparities, residential segregation, and discrimination in realty and lending have dampened African American homeownership. Ranked by the ratio between white and black homeownership (Figure 14), Midwestern states fall into two cohorts. Six states (MI, MO, IL, IN, KS, OH), including the five with the largest African-American population shares in the region, fall into the middle of the distribution—with black and white homeownership close to national rates for both races (about 72 percent for whites and 42 percent for black people58). The other six Midwestern states (ND, SD, MN, IA, WI, NE) crowd the bottom of the distribution, taking six of the bottom ten positions.
Iowa is seventh from the bottom.
RACIAL DISPARITIES IN INCARCERATION
Gordon found,
[E]very Midwestern state imprisons African Americans at more than five times the rate of whites (five being the median ratio among all the states). Five (WI, IA, MN, IL, NE) of the ten worst- performing states, ranked by the ratio between black and white rates, are in the Midwest. Such disparities, glaring in their own right, also have profound impacts on individual, families and communities. Incarceration short circuits equal citizenship—the right to vote, educational and employment opportunities, access to housing—in deep and lasting ways.60
Iowa is third from the bottom.
On a related note, the seventh annual Iowa Summit on Justice & Disparities is scheduled for October 15 in Ankeny. Governor Kim Reynolds and Iowa Supreme Court Chief Justice Mark Cady are among the scheduled speakers at this event, envisioned as a “vehicle to connect stakeholders with resources to work together for significant reduction in the startling rates of minority contact in the criminal justice system in Iowa.” (“African Americans in Iowa are only 3.% of the population, yet they are 26% of the prison population.”)
RACIAL DISPARITIES IN INFANT MORTALITY
A common index of health outcomes is the infant mortality rate—or the number of deaths of children under one year of age for every 1,000 live births (Figure 16). Nationally (2016), the rate for African Americans (11.3 per 1,000) is well over twice the rate for whites (4.8). In the Midwest, only Missouri and Indiana have a better ratio between the black and white rates, and in both settings both the black and white rates are higher than the national average. In the other eight Midwestern states for which we have data (the black population of North and South Dakota are too small for this measure) black infant mortality is more than 2.5 times white infant mortality.
Iowa is twelfth from the bottom.
RACIAL DISPARITIES IN VOTING
Statewide turnout for presidential elections is relatively high in Iowa compared to most states. Unfortunately, Gordon’s analysis showed
there is a substantial turnout gap between white voters and black voters in North Dakota, South Dakota, Kansas, Wisconsin, Nebraska, and Iowa—six Midwestern states that crowd the bottom of the state rankings. In Midwestern settings where black populations are larger, and better incorporated into metropolitan and state politics (Missouri, Ohio, Michigan, and Illinois) the participation gap is narrower.
Iowa is twelfth from the bottom.
INADEQUATE FUNDING FOR CIVIL RIGHTS ENFORCEMENT
Gordon noted, “the capacity of states to address discrimination, especially in employment, has been undermined by deep cuts to the state agencies charged with this task.” Although Bleeding Heartland has covered some of the problems affecting the Iowa Civil Rights Commission, the state of affairs is worse than I’d realized.
Over the last decade, civil rights enforcement agencies in every Midwestern state have seen state appropriations dwindle (Table 4). In real (inflation adjusted) dollars, funding for these agencies across the Midwest has fallen by over
20 percent since 2008-09, with especially steep cuts in Kansas (57 percent) and Iowa (37 percent). In Ohio, these cuts have eliminated more than half of that state’s Commission staff since 2000.124As federal civil rights efforts languish, it is all the more important that state laws and state agencies pick up the slack. We need to extend civil rights protections where federal law falls short (on issues such as fair hiring). We need to ensure adequate funding for civil rights enforcement in the states, without which “universal” policies cannot live up their promise. And such policies are especially important In the Midwest, where—as we have seen–background disparities and patterns of private discrimination are particularly acute.
The last section of Race in the Heartland offers many policy prescriptions for combating racial disparities: adequate funding for public schools, raising the minimum wage, addressing discrimination in the labor market, providing for paid leave and low-cost child care options, a stronger safety net, and so on. All of those ideas are dead letters in Iowa as long as a Republican trifecta is in place. Here’s hoping policy-makers in some other Midwestern states will pick up the ball and make advances we can emulate during the next decade.