
Dan Guild is a lawyer and project manager who lives in New Hampshire. In addition to writing for Bleeding Heartland, he has written for CNN and Sabato’s Crystal Ball. He also contributed to the Washington Post’s 2020 primary simulations. Follow him on X @dcg1114.
“Money is the mother’s milk of politics” – Jesse Unruh
Modern politics is governed by one rule: TV advertising is effective and determines who wins elections.
But against this irresistible force rests an immovable object: President Donald Trump’s approval rating. This table represents the shocking shift in public opinion in the battleground U.S. Senate seats. Data on Trump’s 2024 vote share and approval come from my polling database; approval is based on the average of all polls ended between August 1 and October 23, 2026.

Donald Trump has dominated politics for a decade. But the shift in opinion about him even in states where he won more than 55 percent of the vote is shocking and without historical precedent.
Given this environment, the GOP strategy is simple: hammer Democratic candidates so they become an unacceptable choice from the status quo. To that end $460 million has to change voter’s opinions about the candidates.
Have negative political ads accomplished the task?
Let’s look at the average net favorable ratings for candidates in battleground Senate districts by party.
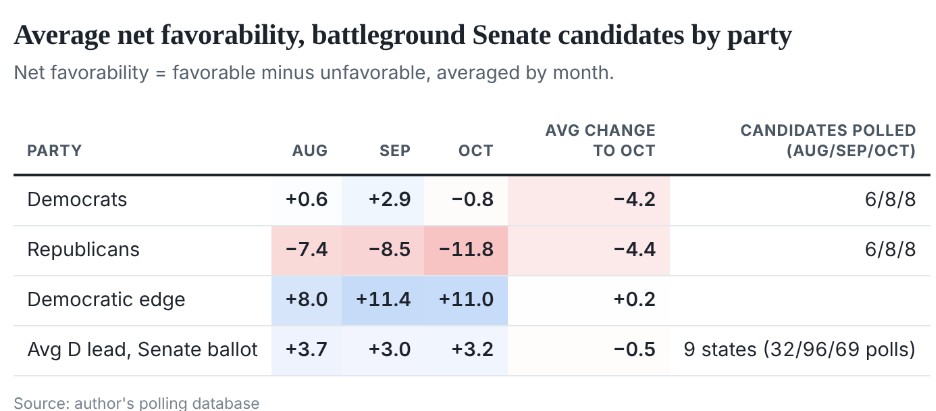
We will get to the individual state data in a second, but you can see three notable findings:
- Throughout this period Democrats have had higher favorables than Republicans.
- Both party candidates are getting more unpopular, though the change is identical for both.
- Despite the changes in favorability, there has been virtually no change in the actual state of the race.
This table ties favorability to campaign spending. The GOP has had a significant advantage in spending throughout this period, but this spending has not been effective. On average, neither the margin nor the Democratic edge in candidate favorability has budged.
The reason, one suspects, is Trump dominates everything. Consider the average net favorability of battlegound Senate candidates by party:

What is stunning is how little the numbers have moved despite more than $1 billion spent on advertising.
Let’s look at the state data. This next table looks at favorability trends by individual candidates.

Race by race
Iowa. Both nominees began the general election liked: Democrat Josh Turek at +13.5, Republican Ashley Hinson at +6.9. Both were then hit hard — Republicans on Turek’s missed votes in the Iowa House, Senate Majority PAC on Hinson’s wealth and voting record. Both fell, Hinson further (−16.9 to Turek’s −12.0), in the one race where pro-Democratic money had the larger share.
Ohio. The most expensive race in the country, and the clearest test of negative money. Roughly $101 million in outside spending opposed former Democratic Senator Sherrod Brown, more than twice what was spent against Republican incumbent Jon Husted. Yet Brown slipped only 3 points while Husted fell 6.3, to −16.3. Ohio voters have been forming opinions of Brown for three decades; another $100 million told them little new.
Michigan. The race that breaks the rules. About $51 million opposed Democrat Abdul El-Sayed, yet his net rating rose 11 points from August. That August figure rests on a single poll, though; from September to October he fell from +3.4 to −2.0. Mike Rogers drifted down 8 points with almost no outside money spent on his behalf.
Texas. One super PAC, Texas PAC, split its money almost evenly: $69.6 million supporting Republican Ken Paxton and $70.6 million opposing Democrat James Talarico. Talarico lost 6.2 points. But despite the positive spending, Paxton still lost 2.3 and sits at −17.5, the worst rating in the set.
Maine. Troy Jackson entered as a late replacement Democratic nominee and absorbed a Republican advertising edge of about $30 million; he dipped 3 points. GOP incumbent Susan Collins, backed by tens of millions in positive ads, is the one candidate whose rating clearly improved (+4.9) — though she remains underwater at −5.1.
New Hampshire and Alaska. Both Democrats lost ground (Chris Pappas −7.0, Mary Peltola −9.0) while the Republicans held roughly steady. Peltola is the sharpest example of the pattern: +7.0 in September, −2.0 a month later.
Negative money finds the liked
Where a candidate started predicts where they ended far better than who outspent whom. Across all fourteen nominees, starting net favorability and the change that followed correlate at −0.66; the pro-Democratic share of spending and the Democrat-minus-Republican shift in each race correlate at just 0.34.
To my surprise, one of the outliers here is El-Sayed. His numbers recovered from a brutal primary and then were stable after a torrent of GOP negative advertising.

We are still five days out from an election that could be the biggest landslide in 20 years. But the polling since 2016 has been uneven to say the least, and the GOP entered the final week of the campaign with a significant edge in money.
Whether that spending advantage will prove the old adage that money is the mother’s milk of politics, though, is very much in question.
After all, maybe money can’t buy a Trump-led GOP love.