Early voting won’t begin in Iowa until October 5, but signs already point to a high-turnout election, with many more Iowans casting early ballots than in the past. By September 25, more than five weeks before this year’s election, 583,944 people–more a quarter of Iowa’s 2 million active registered voters–had requested an absentee ballot. That number doesn’t include anyone planning to vote early in person next month.
Just before the 2016 presidential election, 693,709 Iowans had requested absentee ballots, and county auditors had received 653,438 completed ballots. We should surpass that number well before November 3. About 41 percent of Iowans voted early in 2016, but the COVID-19 pandemic will surely push that percentage higher.
I will update this page every weekday with the latest absentee ballot numbers released by the Iowa Secretary of State’s office, presented in two tables.
The first shows the number of absentee ballots Iowans have requested, in each of the four Congressional districts and statewide. The second shows the number of absentee ballots county auditors have received from voters, in each Congressional district and statewide. For now, those numbers are small, reflecting military or overseas voters. Most Iowans won’t receive their absentee ballot until after October 5.
When an Iowan votes early in person, either at a county auditor’s office or at a satellite location, that counts as a ballot requested by the voter and as a ballot received by the auditor on the same day.
You can compare this year’s numbers to daily charts from the last four election cycles by clicking through to Bleeding Heartland’s archive of absentee ballot totals from 2018, 2016, 2014, and 2012.
Iowa Democrats traditionally rely more on early voters than do Republicans, both in midterm elections and in presidential years.
The tables below show that as of September 25, registered Democrats had requested nearly twice as many absentee ballots as Republicans had. But an early vote lead does not guarantee victory for any candidate. Hillary Clinton received about 60,000 more votes than Donald Trump did among Iowans who cast ballots before November 8, 2016. But Trump outpolled Clinton on election day in Iowa by more than 200,000.
You can find the latest absentee ballot figures in each county or Iowa House or Iowa Senate district on the Secretary of State’s website. At this writing, Democrats have requested more absentee ballots in most state legislative districts, including most that both parties will likely target.
Women and older people are also more likely to vote early. Tables released by the Secretary of State’s office before the election aren’t broken down by gender or age group, but we’ll learn whether that trend continued when the statewide statistical report is released, probably in January 2021.
| Absentee ballots requested by Iowa voters as of November 5, 2020 |
| Congressional district |
Democrats |
Republicans |
no-party |
other |
total |
| IA-01 |
126,439 |
78,820 |
60,508 |
1,385 |
267,152 |
| IA-02 |
133,483 |
83,472 |
62,511 |
1,386 |
280,852 |
| IA-03 |
133,229 |
85,882 |
55,920 |
1,532 |
276,563 |
| IA-04 |
88,305 |
103,889 |
48,255 |
1,051 |
241,500 |
| |
| statewide |
481,456 |
352,063 |
227,194 |
5,354 |
1,066,067 |
| Absentee ballots received by Iowa county auditors as of November 5, 2020 |
| Congressional district |
Democrats |
Republicans |
no-party |
other |
total |
| IA-01 |
121,035 |
75,798 |
57,861 |
1,302 |
255,996 |
| IA-02 |
123,611 |
79,046 |
57,964 |
1,282 |
261,903 |
| IA-03 |
124,745 |
80,703 |
51,629 |
1,386 |
258,463 |
| IA-04 |
81,880 |
98,061 |
45,557 |
980 |
226,478 |
| |
| statewide |
451,271 |
333,608 |
213,011 |
4,950 |
1,002,840 |
| Absentee ballots requested by Iowa voters as of November 4, 2020 |
| Congressional district |
Democrats |
Republicans |
no-party |
other |
total |
| IA-01 |
126,437 |
78,806 |
60,509 |
1,379 |
267,131 |
| IA-02 |
133,497 |
83,474 |
62,517 |
1,386 |
280,874 |
| IA-03 |
133,230 |
85,883 |
55,921 |
1,532 |
276,566 |
| IA-04 |
88,307 |
103,890 |
48,256 |
1,051 |
241,504 |
| |
| statewide |
481,471 |
352,053 |
227,203 |
5,348 |
1,066,075 |
| Absentee ballots received by Iowa county auditors as of November 4, 2020 |
| Congressional district |
Democrats |
Republicans |
no-party |
other |
total |
| IA-01 |
120,806 |
75,616 |
57,583 |
1,287 |
255,292 |
| IA-02 |
123,548 |
79,010 |
57,934 |
1,281 |
261,773 |
| IA-03 |
124,730 |
80,680 |
51,614 |
1,385 |
258,409 |
| IA-04 |
81,841 |
98,012 |
45,533 |
980 |
226,366 |
| |
| statewide |
450,925 |
333,318 |
212,664 |
4,933 |
1,001,840 |
| Absentee ballots requested by Iowa voters as of November 2, 2020 |
| Congressional district |
Democrats |
Republicans |
no-party |
other |
total |
| IA-01 |
124,453 |
76,457 |
57,847 |
1,280 |
260,037 |
| IA-02 |
131,525 |
80,732 |
59,880 |
1,278 |
273,415 |
| IA-03 |
131,770 |
83,728 |
54,122 |
1,471 |
271,091 |
| IA-04 |
86,424 |
99,536 |
44,955 |
951 |
231,866 |
| |
| statewide |
474,172 |
340,453 |
216,804 |
4,980 |
1,036,409 |
| Absentee ballots received by Iowa county auditors as of November 2, 2020 |
| Congressional district |
Democrats |
Republicans |
no-party |
other |
total |
| IA-01 |
117,667 |
72,267 |
53,702 |
1,163 |
244,799 |
| IA-02 |
120,328 |
75,289 |
54,068 |
1,150 |
250,835 |
| IA-03 |
121,329 |
76,844 |
47,986 |
1,276 |
247,435 |
| IA-04 |
78,831 |
92,112 |
41,110 |
849 |
212,902 |
| |
| statewide |
438,155 |
316,512 |
196,866 |
4,438 |
955,971 |
| Absentee ballots requested by Iowa voters as of October 31, 2020 |
| Congressional district |
Democrats |
Republicans |
no-party |
other |
total |
| IA-01 |
122,700 |
74,661 |
55,782 |
1,213 |
254,356 |
| IA-02 |
129,235 |
78,166 |
57,127 |
1,204 |
265,732 |
| IA-03 |
130,470 |
82,139 |
52,911 |
1,422 |
266,942 |
| IA-04 |
85,081 |
96,891 |
43,014 |
906 |
225,892 |
| |
| statewide |
467,486 |
331,857 |
208,834 |
4,745 |
1,012,922 |
| Absentee ballots received by Iowa county auditors as of October 31, 2020 |
| Congressional district |
Democrats |
Republicans |
no-party |
other |
total |
| IA-01 |
115,337 |
69,921 |
50,994 |
1,080 |
237,332 |
| IA-02 |
117,397 |
72,131 |
50,715 |
1,063 |
241,306 |
| IA-03 |
119,071 |
74,341 |
45,933 |
1,207 |
240,552 |
| IA-04 |
77,028 |
88,783 |
38,735 |
797 |
205,343 |
| |
| statewide |
428,833 |
305,176 |
186,377 |
4,147 |
924,533 |
| Absentee ballots requested by Iowa voters as of October 30, 2020 |
| Congressional district |
Democrats |
Republicans |
no-party |
other |
total |
| IA-01 |
120,964 |
72,189 |
53,356 |
1,136 |
247,645 |
| IA-02 |
127,063 |
75,046 |
54,416 |
1,117 |
251,462 |
| IA-03 |
129,268 |
80,275 |
51,588 |
1,373 |
262,504 |
| IA-04 |
83,667 |
92,966 |
40,711 |
842 |
218,186 |
| |
| statewide |
460,962 |
320,476 |
200,071 |
4,468 |
985,977 |
| Absentee ballots received by Iowa county auditors as of October 30, 2020 |
| Congressional district |
Democrats |
Republicans |
no-party |
other |
total |
| IA-01 |
112,647 |
66,589 |
47,729 |
987 |
227,952 |
| IA-02 |
114,193 |
68,229 |
47,157 |
956 |
230,535 |
| IA-03 |
116,292 |
71,094 |
43,348 |
1,114 |
231,848 |
| IA-04 |
74,754 |
83,599 |
35,696 |
713 |
194,762 |
| |
| statewide |
417,886 |
289,511 |
173,930 |
3,770 |
885,097 |
| Absentee ballots requested by Iowa voters as of October 29, 2020 |
| Congressional district |
Democrats |
Republicans |
no-party |
other |
total |
| IA-01 |
119,496 |
70,382 |
51,677 |
1,090 |
242,645 |
| IA-02 |
125,264 |
72,697 |
52,445 |
1,056 |
251,462 |
| IA-03 |
128,241 |
78,756 |
50,581 |
1,340 |
258,918 |
| IA-04 |
82,682 |
90,499 |
39,285 |
809 |
213,275 |
| |
| statewide |
455,683 |
312,334 |
193,988 |
4,295 |
966,300 |
| Absentee ballots received by Iowa county auditors as of October 29, 2020 |
| Congressional district |
Democrats |
Republicans |
no-party |
other |
total |
| IA-01 |
110,105 |
63,792 |
45,105 |
920 |
219,922 |
| IA-02 |
111,351 |
64,894 |
44,265 |
880 |
221,390 |
| IA-03 |
113,461 |
67,980 |
41,027 |
1,042 |
223,510 |
| IA-04 |
72,751 |
79,522 |
33,347 |
661 |
186,281 |
| |
| statewide |
407,668 |
276,188 |
163,744 |
3,503 |
851,103 |
| Absentee ballots requested by Iowa voters as of October 28, 2020 |
| Congressional district |
Democrats |
Republicans |
no-party |
other |
total |
| IA-01 |
117,960 |
68,625 |
50,166 |
1,048 |
237,799 |
| IA-02 |
123,553 |
70,481 |
50,706 |
1,015 |
245,755 |
| IA-03 |
127,068 |
77,299 |
49,613 |
1,310 |
255,290 |
| IA-04 |
81,784 |
88,149 |
37,991 |
777 |
208,701 |
| |
| statewide |
450,365 |
304,554 |
188,476 |
4,150 |
947,545 |
| Absentee ballots received by Iowa county auditors as of October 28, 2020 |
| Congressional district |
Democrats |
Republicans |
no-party |
other |
total |
| IA-01 |
107,019 |
60,709 |
42,412 |
853 |
210,993 |
| IA-02 |
108,125 |
61,419 |
41,390 |
819 |
211,753 |
| IA-03 |
110,345 |
64,736 |
38,637 |
980 |
214,698 |
| IA-04 |
70,868 |
75,698 |
31,289 |
619 |
178,474 |
| |
| statewide |
396,357 |
262,562 |
153,728 |
3,271 |
815,918 |
| Absentee ballots requested by Iowa voters as of October 27, 2020 |
| Congressional district |
Democrats |
Republicans |
no-party |
other |
total |
| IA-01 |
116,610 |
66,909 |
48,785 |
1,000 |
233,304 |
| IA-02 |
121,888 |
68,288 |
49,123 |
961 |
240,260 |
| IA-03 |
126,164 |
75,978 |
48,854 |
1,285 |
252,281 |
| IA-04 |
80,970 |
85,882 |
36,861 |
759 |
204,472 |
| |
| statewide |
445,632 |
297,057 |
183,623 |
4,005 |
930,317 |
| Absentee ballots received by Iowa county auditors as of October 27, 2020 |
| Congressional district |
Democrats |
Republicans |
no-party |
other |
total |
| IA-01 |
104,228 |
57,695 |
39,814 |
788 |
202,525 |
| IA-02 |
105,290 |
58,198 |
38,897 |
744 |
203,129 |
| IA-03 |
107,207 |
61,558 |
36,400 |
925 |
206,090 |
| IA-04 |
69,292 |
72,132 |
29,556 |
586 |
171,566 |
| |
| statewide |
386,017 |
249,583 |
144,667 |
3,043 |
783,310 |
| Absentee ballots requested by Iowa voters as of October 26, 2020 |
| Congressional district |
Democrats |
Republicans |
no-party |
other |
total |
| IA-01 |
115,737 |
65,608 |
47,814 |
975 |
230,134 |
| IA-02 |
120,447 |
66,246 |
47,702 |
934 |
235,329 |
| IA-03 |
125,355 |
74,805 |
48,202 |
1,268 |
249,630 |
| IA-04 |
80,251 |
83,718 |
35,906 |
743 |
200,618 |
| |
| statewide |
441,790 |
290,377 |
179,624 |
3,920 |
915,711 |
| Absentee ballots received by Iowa county auditors as of October 26, 2020 |
| Congressional district |
Democrats |
Republicans |
no-party |
other |
total |
| IA-01 |
101,675 |
55,068 |
37,683 |
748 |
195,174 |
| IA-02 |
102,253 |
54,895 |
36,461 |
701 |
194,310 |
| IA-03 |
104,354 |
58,752 |
34,543 |
892 |
198,541 |
| IA-04 |
67,124 |
68,025 |
27,660 |
552 |
163,361 |
| |
| statewide |
375,406 |
236,740 |
136,347 |
2,893 |
751,386 |
| Absentee ballots requested by Iowa voters as of October 24, 2020 |
| Congressional district |
Democrats |
Republicans |
no-party |
other |
total |
| IA-01 |
114,178 |
64,232 |
46,490 |
939 |
225,839 |
| IA-02 |
118,501 |
64,816 |
46,251 |
905 |
230,473 |
| IA-03 |
123,967 |
73,556 |
47,151 |
1,233 |
245,907 |
| IA-04 |
79,060 |
82,034 |
34,780 |
717 |
196,591 |
| |
| statewide |
435,706 |
284,638 |
174,672 |
3,794 |
898,810 |
| Absentee ballots received by Iowa county auditors as of October 24, 2020 |
| Congressional district |
Democrats |
Republicans |
no-party |
other |
total |
| IA-01 |
98,922 |
52,794 |
35,683 |
686 |
188,085 |
| IA-02 |
99,222 |
52,732 |
34,508 |
663 |
187,125 |
| IA-03 |
101,009 |
56,394 |
32,619 |
843 |
190,865 |
| IA-04 |
64,953 |
65,124 |
25,963 |
519 |
156,559 |
| |
| statewide |
364,106 |
227,044 |
128,773 |
2,711 |
722,634 |
| Absentee ballots requested by Iowa voters as of October 23, 2020 |
| Congressional district |
Democrats |
Republicans |
no-party |
other |
total |
| IA-01 |
112,646 |
62,373 |
44,926 |
896 |
220,841 |
| IA-02 |
116,299 |
62,691 |
44,303 |
868 |
224,161 |
| IA-03 |
122,076 |
71,317 |
45,546 |
1,189 |
240,128 |
| IA-04 |
77,890 |
79,590 |
33,368 |
680 |
191,528 |
| |
| statewide |
428,911 |
275,971 |
168,143 |
3,633 |
876,658 |
| Absentee ballots received by Iowa county auditors as of October 23, 2020 |
| Congressional district |
Democrats |
Republicans |
no-party |
other |
total |
| IA-01 |
95,726 |
49,761 |
33,399 |
628 |
179,514 |
| IA-02 |
95,205 |
49,460 |
31,706 |
611 |
176,982 |
| IA-03 |
96,718 |
52,572 |
30,104 |
779 |
180,173 |
| IA-04 |
62,720 |
61,252 |
24,124 |
469 |
148,565 |
| |
| statewide |
350,369 |
213,045 |
119,333 |
2,487 |
685,234 |
| Absentee ballots requested by Iowa voters as of October 22, 2020 |
| Congressional district |
Democrats |
Republicans |
no-party |
other |
total |
| IA-01 |
111,336 |
60,900 |
43,655 |
868 |
216,759 |
| IA-02 |
114,639 |
61,070 |
43,022 |
820 |
219,551 |
| IA-03 |
120,786 |
69,888 |
44,552 |
1,169 |
236,395 |
| IA-04 |
76,924 |
77,693 |
32,403 |
668 |
187,688 |
| |
| statewide |
423,685 |
269,551 |
163,632 |
3,525 |
860,393 |
| Absentee ballots received by Iowa county auditors as of October 22, 2020 |
| Congressional district |
Democrats |
Republicans |
no-party |
other |
total |
| IA-01 |
92,664 |
47,015 |
31,174 |
583 |
171,436 |
| IA-02 |
91,775 |
46,603 |
29,629 |
560 |
168,567 |
| IA-03 |
92,411 |
48,850 |
27,701 |
711 |
169,673 |
| IA-04 |
59,930 |
57,118 |
22,316 |
443 |
139,807 |
| |
| statewide |
336,780 |
199,586 |
110,820 |
2,297 |
649,483 |
| Absentee ballots requested by Iowa voters as of October 21, 2020 |
| Congressional district |
Democrats |
Republicans |
no-party |
other |
total |
| IA-01 |
109,690 |
59,472 |
41,626 |
837 |
212,285 |
| IA-02 |
112,764 |
59,328 |
41,626 |
786 |
214,504 |
| IA-03 |
119,402 |
68,424 |
43,541 |
1,137 |
232,504 |
| IA-04 |
75,614 |
75,631 |
31,283 |
638 |
183,166 |
| |
| statewide |
417,470 |
262,855 |
158,736 |
3,398 |
842,459 |
| Absentee ballots received by Iowa county auditors as of October 21, 2020 |
| Congressional district |
Democrats |
Republicans |
no-party |
other |
total |
| IA-01 |
88,497 |
43,790 |
28,678 |
536 |
161,501 |
| IA-02 |
87,138 |
42,923 |
27,054 |
509 |
157,624 |
| IA-03 |
87,767 |
45,424 |
25,568 |
661 |
159,420 |
| IA-04 |
56,749 |
52,245 |
20,376 |
411 |
129,781 |
| |
| statewide |
320,151 |
184,382 |
101,676 |
2,117 |
608,326 |
| Absentee ballots requested by Iowa voters as of October 20, 2020 |
| Congressional district |
Democrats |
Republicans |
no-party |
other |
total |
| IA-01 |
108,386 |
58,170 |
41,226 |
811 |
208,593 |
| IA-02 |
111,131 |
57,737 |
40,488 |
750 |
210,106 |
| IA-03 |
118,084 |
67,134 |
42,681 |
1,107 |
229,006 |
| IA-04 |
74,769 |
73,951 |
30,531 |
616 |
179,867 |
| |
| statewide |
412,370 |
256,992 |
154,926 |
3,284 |
827,572 |
| Absentee ballots received by Iowa county auditors as of October 20, 2020 |
| Congressional district |
Democrats |
Republicans |
no-party |
other |
total |
| IA-01 |
84,434 |
40,395 |
26,304 |
492 |
151,625 |
| IA-02 |
83,086 |
39,763 |
24,968 |
465 |
148,282 |
| IA-03 |
82,557 |
41,961 |
23,265 |
592 |
148,375 |
| IA-04 |
54,274 |
49,001 |
18,971 |
380 |
122,626 |
| |
| statewide |
304,351 |
171,120 |
93,508 |
1,929 |
570,908 |
| Absentee ballots requested by Iowa voters as of October 19, 2020 |
| Congressional district |
Democrats |
Republicans |
no-party |
other |
total |
| IA-01 |
106,684 |
56,728 |
39,785 |
780 |
203,977 |
| IA-02 |
109,029 |
55,801 |
39,017 |
709 |
204,556 |
| IA-03 |
116,316 |
65,456 |
41,407 |
1,071 |
224,250 |
| IA-04 |
73,325 |
71,554 |
29,264 |
587 |
174,730 |
| |
| statewide |
405,354 |
249,539 |
149,473 |
3,147 |
807,513 |
| Absentee ballots received by Iowa county auditors as of October 19, 2020 |
| Congressional district |
Democrats |
Republicans |
no-party |
other |
total |
| IA-01 |
78,052 |
36,145 |
23,210 |
438 |
137,845 |
| IA-02 |
77,519 |
35,430 |
22,291 |
398 |
135,638 |
| IA-03 |
74,810 |
36,645 |
20,004 |
507 |
131,966 |
| IA-04 |
49,172 |
42,446 |
16,386 |
329 |
108,333 |
| |
| statewide |
279,553 |
150,666 |
81,891 |
1,672 |
513,782 |
| Absentee ballots requested by Iowa voters as of October 16, 2020 |
| Congressional district |
Democrats |
Republicans |
no-party |
other |
total |
| IA-01 |
104,638 |
55,196 |
38,447 |
738 |
199,019 |
| IA-02 |
106,020 |
53,646 |
37,106 |
658 |
197,430 |
| IA-03 |
114,674 |
63,882 |
40,362 |
1,033 |
219,951 |
| IA-04 |
71,864 |
69,346 |
28,069 |
552 |
169,831 |
| |
| statewide |
397,196 |
242,070 |
143,984 |
2,981 |
786,231 |
| Absentee ballots received by Iowa county auditors as of October 16, 2020 |
| Congressional district |
Democrats |
Republicans |
no-party |
other |
total |
| IA-01 |
72,035 |
32,398 |
20,621 |
377 |
125,431 |
| IA-02 |
69,309 |
30,570 |
18,646 |
316 |
118,841 |
| IA-03 |
68,201 |
32,330 |
17,536 |
433 |
118,500 |
| IA-04 |
42,712 |
35,535 |
13,568 |
280 |
92,095 |
| |
| statewide |
252,257 |
130,833 |
70,371 |
1,406 |
454,867 |
| Absentee ballots requested by Iowa voters as of October 15, 2020 |
| Congressional district |
Democrats |
Republicans |
no-party |
other |
total |
| IA-01 |
102,814 |
53,766 |
37,261 |
697 |
194,538 |
| IA-02 |
103,931 |
51,914 |
35,820 |
626 |
192,291 |
| IA-03 |
113,146 |
62,619 |
39,371 |
990 |
216,126 |
| IA-04 |
70,709 |
67,438 |
27,102 |
531 |
165,780 |
| |
| statewide |
390,600 |
235,737 |
139,554 |
2,844 |
768,735 |
| Absentee ballots received by Iowa county auditors as of October 15, 2020 |
| Congressional district |
Democrats |
Republicans |
no-party |
other |
total |
| IA-01 |
65,333 |
28,131 |
17,922 |
329 |
111,715 |
| IA-02 |
59,795 |
24,925 |
15,256 |
258 |
100,234 |
| IA-03 |
61,717 |
28,217 |
15,315 |
380 |
105,629 |
| IA-04 |
36,741 |
28,209 |
11,021 |
229 |
76,200 |
| |
| statewide |
223,586 |
109,482 |
59,514 |
1,196 |
393,778 |
| Absentee ballots requested by Iowa voters as of October 14, 2020 |
| Congressional district |
Democrats |
Republicans |
no-party |
other |
total |
| IA-01 |
101,420 |
52,577 |
36,277 |
676 |
190,950 |
| IA-02 |
102,044 |
50,505 |
34,743 |
602 |
187,894 |
| IA-03 |
111,739 |
61,391 |
38,540 |
973 |
212,643 |
| IA-04 |
69,713 |
65,997 |
26,362 |
510 |
162,582 |
| |
| statewide |
384,916 |
230,470 |
135,922 |
2,761 |
754,069 |
| Absentee ballots received by Iowa county auditors as of October 14, 2020 |
| Congressional district |
Democrats |
Republicans |
no-party |
other |
total |
| IA-01 |
56,159 |
22,715 |
14,436 |
259 |
93,569 |
| IA-02 |
51,570 |
20,236 |
12,309 |
207 |
84,322 |
| IA-03 |
50,013 |
21,899 |
11,478 |
309 |
83,699 |
| IA-04 |
31,324 |
23,516 |
9,007 |
193 |
64,040 |
| |
| statewide |
189,066 |
88,366 |
47,230 |
968 |
325,630 |
| Absentee ballots requested by Iowa voters as of October 13, 2020 |
| Congressional district |
Democrats |
Republicans |
no-party |
other |
total |
| IA-01 |
99,831 |
51,288 |
35,199 |
649 |
186,967 |
| IA-02 |
99,935 |
48,834 |
33,508 |
567 |
182,844 |
| IA-03 |
109,845 |
59,474 |
37,347 |
940 |
207,606 |
| IA-04 |
68,228 |
63,825 |
25,267 |
474 |
157,794 |
| |
| statewide |
377,839 |
223,421 |
131,321 |
2,630 |
735,211 |
| Absentee ballots received by Iowa county auditors as of October 13, 2020 |
| Congressional district |
Democrats |
Republicans |
no-party |
other |
total |
| IA-01 |
46,851 |
17,991 |
11,271 |
201 |
76,314 |
| IA-02 |
41,087 |
14,884 |
9,366 |
157 |
65,494 |
| IA-03 |
41,203 |
15,936 |
8,929 |
256 |
66,324 |
| IA-04 |
21,740 |
14,268 |
5,987 |
139 |
42,134 |
| |
| statewide |
150,881 |
63,079 |
35,553 |
753 |
250,266 |
| Absentee ballots requested by Iowa voters as of October 12, 2020 |
| Congressional district |
Democrats |
Republicans |
no-party |
other |
total |
| IA-01 |
99,089 |
50,654 |
34,785 |
640 |
185,168 |
| IA-02 |
98,643 |
47,973 |
32,866 |
552 |
180,034 |
| IA-03 |
108,989 |
58,818 |
36,908 |
928 |
205,643 |
| IA-04 |
67,671 |
62,882 |
24,879 |
462 |
155,894 |
| |
| statewide |
374,392 |
220,327 |
129,438 |
2,582 |
726,739 |
| Absentee ballots received by Iowa county auditors as of October 12, 2020 |
| Congressional district |
Democrats |
Republicans |
no-party |
other |
total |
| IA-01 |
42,461 |
16,147 |
10,094 |
178 |
68,880 |
| IA-02 |
36,878 |
12,955 |
8,124 |
137 |
58,094 |
| IA-03 |
34,377 |
12,769 |
7,216 |
204 |
54,566 |
| IA-04 |
18,634 |
12,000 |
5,100 |
119 |
35,853 |
| |
| statewide |
132,350 |
53,871 |
30,534 |
638 |
217,393 |
| Absentee ballots requested by Iowa voters as of October 9, 2020 |
| Congressional district |
Democrats |
Republicans |
no-party |
other |
total |
| IA-01 |
96,239 |
48,598 |
33,009 |
594 |
178,440 |
| IA-02 |
96,068 |
46,145 |
31,432 |
524 |
174,169 |
| IA-03 |
106,899 |
57,122 |
35,731 |
893 |
200,645 |
| IA-04 |
65,874 |
60,520 |
23,697 |
423 |
150,514 |
| |
| statewide |
365,080 |
212,385 |
123,869 |
2,434 |
703,768 |
| Absentee ballots received by Iowa county auditors as of October 9, 2020 |
| Congressional district |
Democrats |
Republicans |
no-party |
other |
total |
| IA-01 |
19,815 |
6,949 |
4,251 |
73 |
31,088 |
| IA-02 |
17,177 |
5,719 |
3,569 |
70 |
26,535 |
| IA-03 |
15,044 |
5,274 |
2,815 |
89 |
23,222 |
| IA-04 |
7,732 |
5,305 |
2,281 |
56 |
15,374 |
| |
| statewide |
59,768 |
23,247 |
12,916 |
288 |
96,219 |
| Absentee ballots requested by Iowa voters as of October 8, 2020 |
| Congressional district |
Democrats |
Republicans |
no-party |
other |
total |
| IA-01 |
94,530 |
47,445 |
32,121 |
577 |
174,673 |
| IA-02 |
94,472 |
45,018 |
30,695 |
511 |
170,696 |
| IA-03 |
105,151 |
55,763 |
34,819 |
859 |
196,592 |
| IA-04 |
64,747 |
58,869 |
22,918 |
407 |
146,941 |
| |
| statewide |
358,900 |
207,095 |
120,553 |
2,354 |
688,902 |
| Absentee ballots received by Iowa county auditors as of October 8, 2020 |
| Congressional district |
Democrats |
Republicans |
no-party |
other |
total |
| IA-01 |
8,864 |
2,967 |
1,913 |
37 |
13,781 |
| IA-02 |
7,505 |
2,528 |
1,553 |
34 |
11,620 |
| IA-03 |
5,205 |
2,026 |
1,018 |
24 |
8,273 |
| IA-04 |
3,754 |
3,156 |
1,329 |
35 |
8,274 |
| |
| statewide |
25,328 |
10,677 |
5,813 |
130 |
41,948 |
| Absentee ballots requested by Iowa voters as of October 7, 2020 |
| Congressional district |
Democrats |
Republicans |
no-party |
other |
total |
| IA-01 |
92,778 |
46,103 |
31,062 |
558 |
170,501 |
| IA-02 |
92,583 |
43,858 |
29,835 |
483 |
166,759 |
| IA-03 |
103,836 |
54,562 |
34,085 |
840 |
193,323 |
| IA-04 |
63,686 |
57,179 |
22,271 |
392 |
143,528 |
| |
| statewide |
352,883 |
201,702 |
117,253 |
2,273 |
674,111 |
| Absentee ballots received by Iowa county auditors as of October 7, 2020 |
| Congressional district |
Democrats |
Republicans |
no-party |
other |
total |
| IA-01 |
2,844 |
1,362 |
864 |
20 |
5,090 |
| IA-02 |
3,132 |
1,431 |
893 |
24 |
5,480 |
| IA-03 |
2,056 |
1,179 |
555 |
14 |
3,804 |
| IA-04 |
2,002 |
1,947 |
865 |
22 |
4,836 |
| |
| statewide |
10,034 |
5,919 |
3,177 |
80 |
19,210 |
| Absentee ballots requested by Iowa voters as of October 6, 2020 |
| Congressional district |
Democrats |
Republicans |
no-party |
other |
total |
| IA-01 |
91,405 |
45,208 |
30,445 |
542 |
167,600 |
| IA-02 |
90,997 |
42,857 |
29,122 |
473 |
163,449 |
| IA-03 |
102,228 |
53,490 |
33,410 |
822 |
189,950 |
| IA-04 |
62,616 |
55,812 |
21,703 |
377 |
140,508 |
| |
| statewide |
347,246 |
197,367 |
114,680 |
2,214 |
661,507 |
| Absentee ballots received by Iowa county auditors as of October 6, 2020 |
| Congressional district |
Democrats |
Republicans |
no-party |
other |
total |
| IA-01 |
1,353 |
683 |
459 |
9 |
2,504 |
| IA-02 |
1,745 |
742 |
487 |
19 |
2,993 |
| IA-03 |
1,035 |
549 |
271 |
10 |
1,865 |
| IA-04 |
1,134 |
1,045 |
493 |
14 |
2,686 |
| |
| statewide |
5,267 |
3,019 |
1,710 |
52 |
10,048 |
| Absentee ballots requested by Iowa voters as of October 5, 2020 |
| Congressional district |
Democrats |
Republicans |
no-party |
other |
total |
| IA-01 |
89,078 |
43,576 |
29,250 |
517 |
162,421 |
| IA-02 |
88,301 |
41,267 |
27,956 |
445 |
157,969 |
| IA-03 |
100,684 |
52,273 |
32,713 |
799 |
186,469 |
| IA-04 |
60,803 |
53,409 |
20,658 |
357 |
135,227 |
| |
| statewide |
338,866 |
190,525 |
110,577 |
2,065 |
642,086 |
| Absentee ballots received by Iowa county auditors as of October 5, 2020 |
| Congressional district |
Democrats |
Republicans |
no-party |
other |
total |
| IA-01 |
181 |
55 |
95 |
2 |
333 |
| IA-02 |
251 |
64 |
76 |
5 |
396 |
| IA-03 |
159 |
71 |
57 |
4 |
291 |
| IA-04 |
180 |
83 |
108 |
7 |
378 |
| |
| statewide |
771 |
273 |
336 |
18 |
1,398 |
| Absentee ballots requested by Iowa voters as of October 2, 2020 |
| Congressional district |
Democrats |
Republicans |
no-party |
other |
total |
| IA-01 |
87,955 |
42,786 |
28,512 |
507 |
159,760 |
| IA-02 |
87,397 |
40,589 |
27,314 |
431 |
155,731 |
| IA-03 |
99,998 |
51,657 |
32,232 |
788 |
184,675 |
| IA-04 |
60,000 |
51,963 |
20,081 |
339 |
132,383 |
| |
| statewide |
335,350 |
186,995 |
108,139 |
2,065 |
632,549 |
| Absentee ballots received by Iowa county auditors as of October 2, 2020 |
| Congressional district |
Democrats |
Republicans |
no-party |
other |
total |
| IA-01 |
173 |
50 |
88 |
0 |
313 |
| IA-02 |
234 |
56 |
74 |
5 |
369 |
| IA-03 |
150 |
63 |
51 |
3 |
267 |
| IA-04 |
168 |
76 |
91 |
6 |
341 |
| |
| statewide |
725 |
245 |
304 |
16 |
1,290 |
| Absentee ballots requested by Iowa voters as of October 1, 2020 |
| Congressional district |
Democrats |
Republicans |
no-party |
other |
total |
| IA-01 |
87,210 |
42,153 |
27,994 |
497 |
157,854 |
| IA-02 |
86,758 |
40,029 |
26,946 |
428 |
154,161 |
| IA-03 |
99,413 |
51,056 |
31,840 |
770 |
183,079 |
| IA-04 |
59,281 |
50,538 |
19,551 |
328 |
129,698 |
| |
| statewide |
332,662 |
183,776 |
106,331 |
2,023 |
624,792 |
| Absentee ballots received by Iowa county auditors as of October 1, 2020 |
| Congressional district |
Democrats |
Republicans |
no-party |
other |
total |
| IA-01 |
113 |
33 |
59 |
0 |
205 |
| IA-02 |
213 |
46 |
61 |
5 |
325 |
| IA-03 |
132 |
60 |
46 |
3 |
241 |
| IA-04 |
156 |
69 |
75 |
6 |
306 |
| |
| statewide |
614 |
208 |
241 |
14 |
1,077 |
| Absentee ballots requested by Iowa voters as of September 30, 2020 |
| Congressional district |
Democrats |
Republicans |
no-party |
other |
total |
| IA-01 |
86,355 |
41,364 |
27,418 |
479 |
155,616 |
| IA-02 |
85,862 |
39,278 |
26,406 |
419 |
151,965 |
| IA-03 |
98,794 |
50,364 |
31,439 |
768 |
181,365 |
| IA-04 |
58,382 |
49,062 |
18,922 |
320 |
126,686 |
| |
| statewide |
329,393 |
180,068 |
104,185 |
1,986 |
615,632 |
| Absentee ballots received by Iowa county auditors as of September 30, 2020 |
| Congressional district |
Democrats |
Republicans |
no-party |
other |
total |
| IA-01 |
108 |
32 |
56 |
0 |
196 |
| IA-02 |
184 |
44 |
56 |
3 |
287 |
| IA-03 |
117 |
54 |
42 |
3 |
216 |
| IA-04 |
142 |
60 |
69 |
6 |
277 |
| |
| statewide |
551 |
190 |
223 |
12 |
976 |
| Absentee ballots requested by Iowa voters as of September 29, 2020 |
| Congressional district |
Democrats |
Republicans |
no-party |
other |
total |
| IA-01 |
85,788 |
40,916 |
27,046 |
474 |
154,224 |
| IA-02 |
84,952 |
38,777 |
25,928 |
398 |
150,055 |
| IA-03 |
97,876 |
49,553 |
30,871 |
754 |
179,054 |
| IA-04 |
57,539 |
48,008 |
18,514 |
310 |
124,371 |
| |
| statewide |
326,155 |
177,254 |
102,359 |
1,936 |
607,704 |
| Absentee ballots received by Iowa county auditors as of September 29, 2020 |
| Congressional district |
Democrats |
Republicans |
no-party |
other |
total |
| IA-01 |
97 |
25 |
43 |
0 |
165 |
| IA-02 |
119 |
29 |
38 |
1 |
187 |
| IA-03 |
104 |
42 |
37 |
3 |
186 |
| IA-04 |
124 |
50 |
58 |
5 |
237 |
| |
| statewide |
444 |
146 |
176 |
9 |
775 |
| Absentee ballots requested by Iowa voters as of September 28, 2020 |
| Congressional district |
Democrats |
Republicans |
no-party |
other |
total |
| IA-01 |
84,351 |
39,702 |
26,175 |
452 |
150,680 |
| IA-02 |
83,603 |
37,423 |
25,098 |
383 |
146,507 |
| IA-03 |
96,949 |
48,688 |
30,345 |
732 |
176,714 |
| IA-04 |
56,125 |
45,758 |
17,546 |
296 |
119,725 |
| |
| statewide |
321,028 |
171,571 |
99,164 |
1,863 |
593,626 |
| Absentee ballots received by Iowa county auditors as of September 28, 2020 |
| Congressional district |
Democrats |
Republicans |
no-party |
other |
total |
| IA-01 |
78 |
21 |
32 |
0 |
131 |
| IA-02 |
97 |
17 |
30 |
1 |
145 |
| IA-03 |
82 |
29 |
26 |
3 |
140 |
| IA-04 |
92 |
35 |
39 |
5 |
171 |
| |
| statewide |
349 |
102 |
127 |
9 |
587 |
| Absentee ballots requested by Iowa voters as of September 25, 2020 |
| Congressional district |
Democrats |
Republicans |
no-party |
other |
total |
| IA-01 |
83,197 |
38,707 |
25,515 |
440 |
147,859 |
| IA-02 |
82,946 |
36,823 |
24,719 |
376 |
144,864 |
| IA-03 |
96,485 |
48,298 |
30,060 |
723 |
175,566 |
| IA-04 |
54,798 |
43,793 |
16,784 |
280 |
115,655 |
| |
| statewide |
317,426 |
167,621 |
97,078 |
1,819 |
583,944 |
| Absentee ballots received by Iowa county auditors as of September 25, 2020 |
| Congressional district |
Democrats |
Republicans |
no-party |
other |
total |
| IA-01 |
68 |
21 |
25 |
0 |
114 |
| IA-02 |
84 |
12 |
24 |
1 |
121 |
| IA-03 |
72 |
25 |
22 |
3 |
122 |
| IA-04 |
79 |
34 |
30 |
4 |
147 |
| |
| statewide |
303 |
88 |
105 |
8 |
504 |
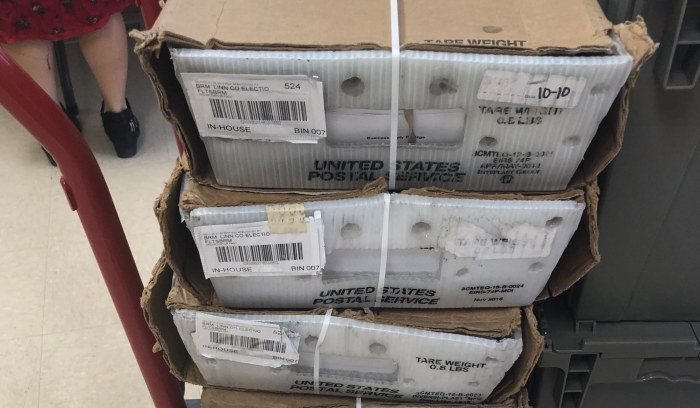
Top image cropped from a photo the Linn County elections office posted on Twitter on July 24. Each tray contains about 1,000 absentee ballot request forms that voters had returned to the county auditor.