
David Elbert is a former business editor and columnist for the Des Moines Register. He now writes about local history for DSM Magazine.
The national debt recently passed the $40 trillion mark, which means your share is about $117,000, or roughly half the cost of a typical Iowa home.
The national debt nearly doubled in the past decade, which is more than twice the rate of inflation during those ten years.
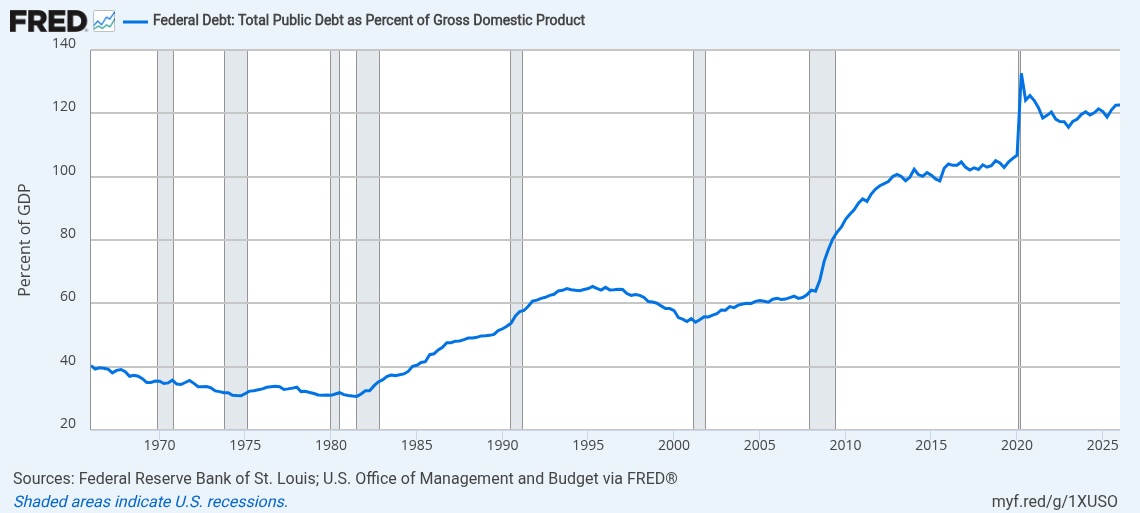
The New York Times published an interesting chart recently that tracked the national debt as a percentage of our Gross Domestic Product (GDP), which is a calculation of all goods and services produced annually.
The chart (shown above) goes back to the 1960s. It shows the national debt as a percent of GDP. The earliest ratio was about 40 percent, meaning the debt was about 40 percent of GDP. It fell to the low-30s in the early 1980s before climbing to near 60 percent in the early 1990s.
The ratio remained around 60 percent until the Great Recession of 2008 when the housing market collapsed and federal spending increased sharply, boosting the ratio to over 100 percent in a just few years.
The sharp increase ignited widespread concern because the 100 percent level meant the national debt was equal to the entire productivity of one year’s goods and services.
That high level of U.S. debt had not been seen since the Great Depression of the 1930s and World War II.
It worried a lot of people, including economists.
But the ratio remained above 100 percent for several years.
And when nothing really bad happened, the flashing red warning signal for an overheated economy faded into background noise.
Then, the COVID-19 pandemic arrived. As the death toll mounted from hundreds of thousands to more than 1.2 million, businesses, schools and life in general shut down for several months. To keep things from going completely south, the federal government pumped huge amounts of money into the economy.
And they kept pumping, arguably longer than was necessary.
But it worked and within a couple years everything was back to relatively normal.
The debt/GDP ratio, which initially climbed above 130 percent, settled in at a new normal of about 120 percent, which is where it remains today.
In this new normal the annual cost to the federal government for interest on the debt is $1.1 trillion a year. That’s the second largest line item in the federal budget after Social Security and Medicare, which combined amount to $2.6 trillion out of total spending of about $6 trillion. The next largest expense is defense, which is around $920 billion and rising.
To me, one of the more amazing aspects of our current situation is the inability of Congress to do its job and oversee the federal budget. Even Iowa’s senior Republican Senator Chuck Grassley, who built a career on calling out federal waste and abuse, is apparently out to lunch.
Meanwhile, investors are daily becoming more nervous about where the tipping point is.
As Margaret Spellings, president of the Bipartisan Policy Center, told the New York Times: “Our federal programs spend much more than the government takes in, and the biggest-ticket items in the federal budget are all running on autopilot.”
“Even in the rosiest scenarios, we’re speeding towards a cliff and refusing to turn the wheel,” Spellings said.
2 Comments
balanced budget
We haven’t had a president serious about balancing the budget since Bill Clinton. Both parties spend like drunken sailors. I wouldn’t mind seeing a balanced budget amendment to reel in the reckless spending and pork projects.
ModerateDem Sun 30 Aug 6:01 PM
It’s a Bit More Complicated.
While government debt has not been well managed in recent years, a balanced budget amendment is not advised for a federal government. Economic policy is more complex than that.
There are times when deficit spending might be needed. War time is an example (thinking WWII, not the current Iran fiasco). Or to spur the economy following significant events, like a pandemic or the 2007 economic meltdown.
When you think about it, many of us run deficits in a responsible way when you consider our mortgages, car loans, educational loans and the like.
Yet I agree with ModerateDem that both parties need to be more responsible managing the federal budget. Currently the most glaring problem is the affluent not paying their fair share of both income and Social Security taxes.
Bill Bumgarner Sun 30 Aug 6:58 PM