
First in a series interpreting the results of Iowa’s 2020 state and federal elections.
As Iowa Democrats begin to regroup after a second straight awful presidential election up and down the ballot, we need to be realistic about where we stand. The first step is recognizing we don’t live in a swing state anymore.
Forthcoming posts will examine the election results in more detail, but let’s start with the big picture.
Iowa’s now far more Republican than the country as a whole.
For six presidential elections in a row, Iowa’s voting was not far off from the nationwide popular vote for the Democratic and Republican candidates. This spreadsheet compiled by Stephen Wolf of the Daily Kos Elections team shows every state’s presidential election results since 1828. Wolf also calculated the “partisan voting index,” a measure of “how strongly a United States congressional district or state leans toward the Democratic or Republican Party, compared to the nation as a whole.”
For example, Iowa was far out of step with the nationwide electorate in 1988, when Iowans favored Michael Dukakis over George H.W. Bush by 54.7 percent to 44.5 percent, while Bush won the overall popular vote by 53.5 percent to 45.6 percent. Iowa’s PVI for that year was D+9, indicating that our state’s residents voted about 9 points more Democratic than did all Americans.
Then Iowa’s streak of being in step with the national mood began.
1992
Bill Clinton defeated George H.W. Bush by 43.0 percent to 37.4 percent nationally, and by 43.3 percent to 37.3 percent in Iowa. PVI: D+0
1996
Clinton defeated Bob Dole by 49.2 percent to 40.7 percent nationally, and by 50.3 percent to 39.9 percent in Iowa. PVI: D+1
2000
Al Gore carried the national popular vote by 48.4 percent to 47.9 percent for George W. Bush, and won Iowa by 48.5 percent to 48.2 percent in Iowa. PVI: R+0
2004
Bush defeated John Kerry by 50.7 percent to 48.3 percent nationally, and by 49.9 percent to 49.2 percent in Iowa. PVI: D+1
2008
Barack Obama defeated John McCain by 52.9 percent to 45.6 percent nationally, and by 53.9 percent to 44.4 percent in Iowa. PVI: D+1
2012
Obama defeated Mitt Romney by 51.0 percent to 47.1 percent nationally, and by 52.0 percent to 46.2 percent in Iowa. PVI: D+1
Our bellwether status was surprising, in light of the state’s overwhelmingly white electorate, which doesn’t match the demographics of the country. Still, I assumed we would continue to track fairly close to the national vote in presidential years.
The last election upended that assumption. While Hillary Clinton won the national popular vote by 48.0 percent to 45.9 percent, Donald Trump carried Iowa by 51.1 percent to 41.7 percent. That produced a PVI of R+6.
Some Iowa Democrats believed the 2016 election was an aberration, stemming from an aversion to Clinton. According to that theory, we should have reverted to our norm once misogyny (or, if you prefer, Clinton’s unique baggage) was taken out of the equation.
It didn’t happen.
With millions of votes still not reported–California is slow to tally its mailed ballots–we don’t yet know the scale of Joe Biden’s popular vote victory. But he’s leading Trump by about 3 percent nationally, and the gap could grow to 4 percent or more.
Unofficial results show Trump winning Iowa by 896,294 votes to 757,588, or 53.1 percent to 44.9 percent. Biden received about 104,000 more votes than Clinton and improved on her share of the vote, but still finished 8 points behind Trump–barely more competitive than the 2016 race.
Assuming Biden ends up with about 52 percent of the national vote (he’s at 50.6 percent now), Iowa’s PVI for this election would be in the range of R+7.
Biden did not flip a single Iowa county Trump carried in 2016. He won the same six that voted for Clinton. Despite losing the 2018 governor’s race by about 3 points, Fred Hubbell carried eleven of the 99 counties.
More distressing for Democrats: Trump increased his vote share in many of the counties he won this year. For instance, he carried traditionally Democratic Dubuque and Clinton counties with less than 50 percent of the vote in the last election. This year he was above 50 percent in both, even as overall turnout increased.
I’ll make a fancier interactive map once the county-level numbers are finalized, but here’s the quick and dirty version of the 2020 voting for president.
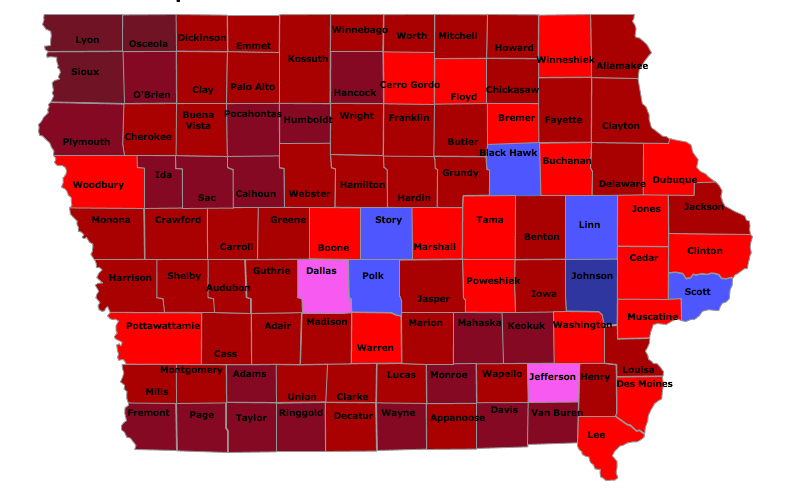
The two pink counties are where Trump outpolled Biden but didn’t hit the 50 percent mark. In the 20 bright red counties, Trump’s vote share was between 50 and 60 percent. Those included traditionally Democratic areas like Des Moines County (Burlington), Lee County (Keokuk), Marshall County (Marshalltown), Cerro Gordo County (Mason City), and the aforementioned Dubuque and Clinton.
In 49 slightly darker counties, Trump received between 60 and 70 percent of votes cast. Those included longtime Democratic strongholds like Wapello County (Ottumwa), Jasper County (Newton), Jackson County (Maquoketa), and Webster County (Fort Dodge).
In nineteen darker red counties, Trump was above 70 percent. And in Iowa’s far northwest corner, Trump surpassed 80 percent of the vote in three counties.
I could end the post here, but I want to highlight two more realities that came into focus on Tuesday night.
Iowa has no Democratic-leaning Congressional districts.
Abby Finkenauer and Cindy Axne defeated Republican incumbents in 2018, giving Democrats three of the state’s four seats in the U.S. House. Finkenauer lost narrowly to Ashley Hinson in IA-01 (51.3 percent to 48.7 percent). Axne held on for re-election in IA-03 (48.9 percent to 47.6 percent). In the second district, where Democrat Dave Loebsack retired after fourteen years, we’re headed for a recount as Republican Mariannette Miller-Meeks leads Democrat Rita Hart by 282 votes out of 393,963 cast (49.95 percent to 49.87 percent).
Trump carried all of those districts in the last presidential election, but Democrats had reason to think his success was a fluke driven by Clinton’s unpopularity. Consider:
IA-01 went for Barack Obama in 2012 by 56.2 percent to 42.5 percent but went to Trump in 2016 by 48.7 percent to 45.2 percent.
IA-02 went for Obama in 2012 by 55.8 percent to 42.7 percent but went to Trump in 2016 by 49.1 percent to 45.0 percent.
IA-03 went for Obama in 2012 by 51.4 percent to 47.2 percent but went to Trump in 2016 by 48.5 percent to 45.0 percent.
Based on various opinion polls showing a tight race between Biden and Trump statewide, I guessed that Biden was probably leading in the Democratic-held Congressional districts. The fourth district is overwhelmingly Republican; voters there favored Trump in 2016 by 60.9 percent to 33.5 percent.
In reality, Trump and Biden roughly tied in IA-03 (the Republican received about 545 more votes out of nearly 450,000 cast). Current data indicate that Trump received 52 percent of the two-party vote in IA-02 and 51.7 percent in IA-01.
The Cook Political Report calculates the PVI for Congressional districts from the two most recent presidential elections. The current PVIs for Iowa’s four House seats are D+1 for IA-01, D+1 for IA-02, R+1 for IA-03, and R+11 for IA-04.
That will change dramatically once Obama’s showing from 2012 doesn’t factor into the math. Looking only at the 2016 and 2020 presidential voting, I would guess that the PVI for the two eastern Iowa districts will be in the R+4 to R+5 range. The third district might be more like R+3. DECEMBER UPDATE: After the national popular vote was finalized, I calculated the PVIs for the first and second districts at R+4. The third district as currently configured is R+3.
Under the political map Iowa will adopt next year, the district containing Polk County is sure to become a little more Democratic and could become much more so, depending on which rural counties it loses and whether Story County is swapped out for Pottawattamie. Perhaps Linn and Johnson Counties will be part of the same district, which also would lean Democratic.
My point is that Democrats need to stop thinking about eastern Iowa as generally friendly territory. As a group, residents of the two Congressional districts in the eastern half of the state voted significantly more Republican than did the country as a whole. If the map for the 2020s resembles the current one, Democratic Congressional candidates will face an uphill battle.
One more point to consider:
Iowa’s no-party voters seem to have favored Republicans.
Secretary of State Paul Pate posted unofficial numbers from early and election day voting on his Twitter feed November 5.
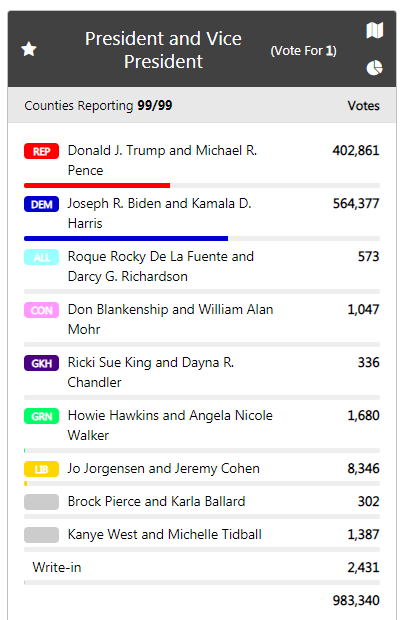
Going into election day, Iowa Democrats had returned about 118,000 more absentee ballots than Republicans. Biden ended up winning the early vote by 161,516. While he probably received some crossover votes from registered Republicans, I would guess that he had support from roughly 60 percent of the 213,000 or so independents who voted before November 3.
Here’s the election day vote.
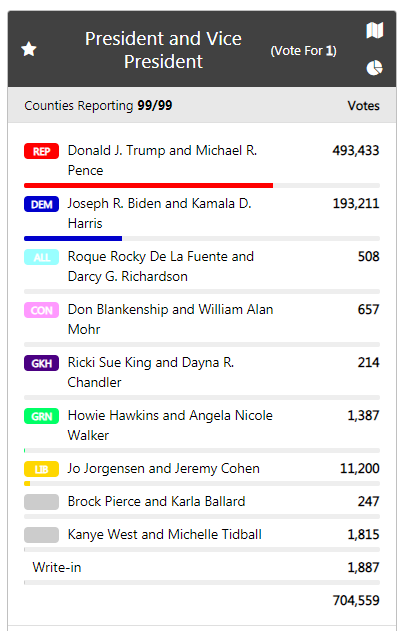
We’ll know more about how many Democrats, Republicans, and no-party voters turned out on election day when the Secretary of State’s office publishes the statistical report in January. I don’t believe Trump could have received a 300,000-vote margin on November 3 without a clear advantage among voters affiliated with neither party.
Final thoughts
My intent is not to make Democrats feel hopeless. Iowa’s a red state now, but that doesn’t mean Republicans are guaranteed to hold power forever. A generation ago, who would have believed Colorado and Virginia would be considered safe states for the Democratic presidential nominee in 2020?
In recent years, Democrats have been elected governor in Kansas (PVI R+12), Louisiana (R+11), and Kentucky (R+17). By the same token, voters in Maryland (D+13) and Massachusetts (D+14) have chosen Republican governors. Lots of House Democrats have represented GOP-leaning Congressional districts, and vice versa.
So a Democratic candidate could win a statewide election in Iowa. But we need to approach the 2022 races for governor and U.S. Senate without any illusions. We aren’t on level ground with Republicans. We start out at a significant disadvantage, even if Senator Chuck Grassley retires.
We also can’t assume that low-propensity Republican voters won’t come back when Trump isn’t on the ballot. The Iowa GOP will devote substantial resources to turning those people into reliable voters.
The first step toward solving a problem is admitting the problem exists.
3 Comments
So, looking at the spreadsheet...
…Iowa, with a PVI of R+7, is close to the PVI scores that three states had in 2016 — Texas, South Carolina, and Alaska. That’s nothing to be delighted about. But Oklahoma, in 2016, had a PVI of R+20, and South Dakota had R+17. And Wyoming had a PVI of R+27. Perspective helps.
PrairieFan Fri 6 Nov 9:08 PM
Irritating, yes, but...
With it looking like Biden win, still feeling like this right now.
And Blaire Erskine has a funny bit on our type of pain, but as felt from the other side down in Georgia here.
Thanks for everything, Laura. I was independently wondering earlier this week about how Iowa votes compared to nation historically, and then dang if Laura doesn’t serve it right up with that linked spreadsheet and more. Good on you! Groovy!
Fly_Fly__Fly_Away Sat 7 Nov 12:15 AM
I keep getting confused...
Are these maps of COVID-19 cases or political maps? Almost all the red counties seem to be the same. (Tongue firmly in cheek.)
khamjo Sun 8 Nov 10:25 AM