UPDATE: State officials changed their methodology for counting COVID-19 deaths in early December 2020. Original post follows.
The state’s official website on the coronavirus pandemic regularly understates the number of Iowans who have died of COVID-19, Bleeding Heartland’s analysis of U.S. Centers for Disease Control data indicates.
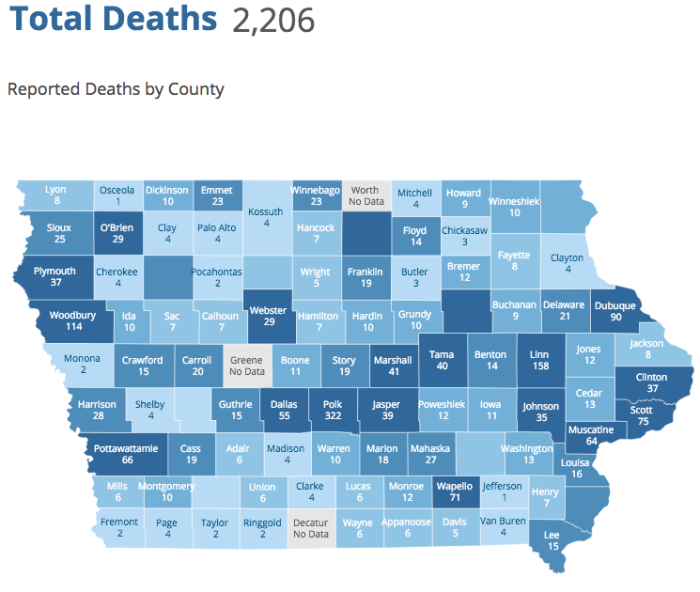
The Iowa Department of Public Health submitted information to the CDC indicating that 2,099 Iowans had died from COVID-19 through the week ending November 7. The latest figures published on coronavirus.iowa.gov show 2,206 total deaths, but account for only 1,920 deaths through November 7.
Sara Anne Willette, who maintains the Iowa COVID-19 Tracker website, has noticed the same discrepancy. It may explain why IDPH communications staff never answered Bleeding Heartland’s many inquiries about how the state counts coronavirus fatalities.
“MULTIPLE CAUSE” VS. “UNDERLYING CAUSE” DEATHS
The state’s website has a page described as “a summary dashboard of COVID-19 cases resulting in death,” with no further explanation. As Bleeding Heartland first reported in July, the CDC reports two sets of COVID-19 death numbers. The IDPH has never clarified which counting method is used for coronavirus.iowa.gov.
The CDC’s “weekly counts of deaths by state and select cause” table includes two columns for COVID-19: “Multiple Cause of Death” and “Underlying Cause of Death.”
The “underlying cause” deaths are a subset of the “multiple cause” deaths, Jeff Lancashire told me in July. He’s a public affairs officer for the CDC’s National Center for Health Statistics.
“Multiple cause” in this case indicates that we are counting from the multiple cause fields, i.e., we are selecting cases with any mention of COVID-19, regardless whether it was the underlying cause or not. Underlying cause indicates that among all conditions reported on the death certificate, COVID-19 was the underlying cause of death. When COVID-19 is reported on the death certificate, but is not the underlying cause, it can be described as a factor contributing to death.
Lancashire emphasized,
It is important to note that the death certificate is designed to elicit only those conditions that caused or contributed to death. It does not indicate the number that died with (i.e., that had) COVID-19. Simply testing positive for COVID-19 is not sufficient for inclusion on the death certificate. If COVID-19 is not a cause of death or contributory factor, it should not be reported on the death certificate.
ONE COUNTING METHOD SHOWS NEARLY 200 MORE LIVES LOST
I created this table using the CDC’s weekly counts, as the data appeared on November 21. The CDC statistics are based on information from state public health departments, but often lag a bit behind. So while IDPH reported our state’s first fatal COVID-19 infection on March 24, the CDC database shows the first Iowa deaths occurring during the week that ended April 4.
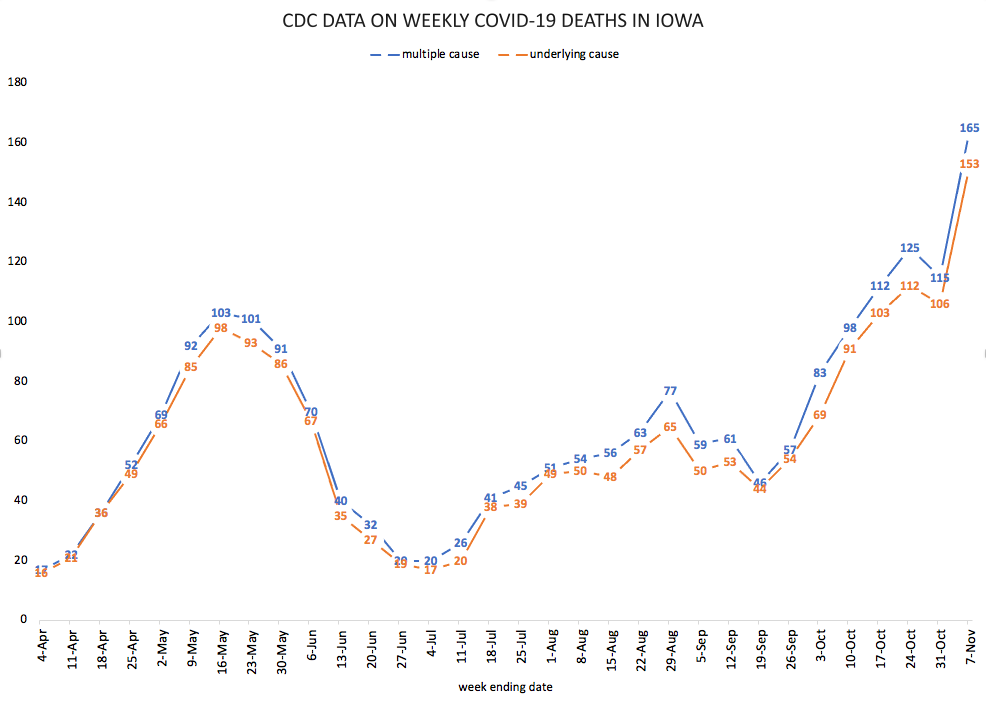
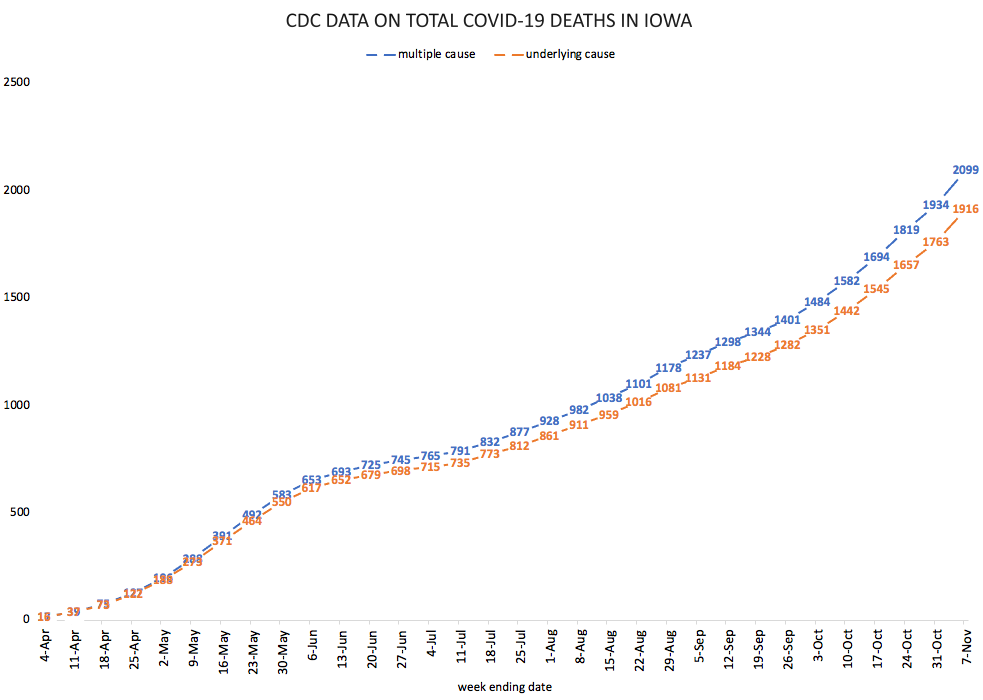
Almost every week, the number of Iowans for whom COVID-19 was the “underlying cause” of death is a little lower than the number for whom coronavirus was a contributing factor. The two columns on the right show cumulative deaths in the pandemic. Through the first week in November, the CDC was reporting 183 more “multiple cause” than “underlying cause” deaths in Iowa. Numbers for recent weeks may increase as more death certificates are processed.
| CDC data on Iowa’s COVID-19 deaths in 2020 | ||||
| Week ending date | weekly multiple cause | weekly underlying cause | total multiple cause | total underlying cause |
|---|---|---|---|---|
| April 4 | 17 | 16 | 17 | 16 |
| April 11 | 22 | 21 | 39 | 37 |
| April 18 | 36 | 36 | 75 | 73 |
| April 25 | 52 | 49 | 127 | 122 |
| May 2 | 69 | 66 | 196 | 188 |
| May 9 | 92 | 85 | 288 | 273 |
| May 16 | 103 | 98 | 391 | 371 |
| May 23 | 101 | 93 | 492 | 464 |
| May 30 | 91 | 86 | 583 | 550 |
| June 6 | 70 | 67 | 653 | 617 |
| June 13 | 40 | 35 | 693 | 652 |
| June 20 | 32 | 27 | 725 | 679 |
| June 27 | 20 | 19 | 745 | 698 |
| July 4 | 20 | 17 | 765 | 715 |
| July 11 | 26 | 20 | 791 | 735 |
| July 18 | 41 | 38 | 832 | 773 |
| July 25 | 45 | 39 | 877 | 812 |
| August 1 | 51 | 49 | 928 | 861 |
| August 8 | 54 | 50 | 982 | 911 |
| August 15 | 56 | 48 | 1,038 | 959 |
| August 22 | 63 | 57 | 1,101 | 1,016 |
| August 29 | 77 | 65 | 1,178 | 1,081 |
| Sept 5 | 59 | 50 | 1,237 | 1,131 |
| Sept 12 | 61 | 53 | 1,298 | 1,184 |
| Sept 19 | 46 | 44 | 1,344 | 1,228 |
| Sept 26 | 57 | 54 | 1,401 | 1,282 |
| October 3 | 83 | 69 | 1,484 | 1,351 |
| October 10 | 98 | 91 | 1,582 | 1,442 |
| October 17 | 112 | 103 | 1,694 | 1,545 |
| October 24 | 125 | 112 | 1,819 | 1,657 |
| October 31 | 115 | 106 | 1,934 | 1,763 |
| November 7 | 165 | 153 | 2,099 | 1,916 |
I used the same CDC data to make the next two charts. You can see the disparity from week to week.
While IDPH staff stonewalled me over the summer, I asked Lancashire whether the CDC knew how the state was calculating the published COVID-19 death numbers. He didn’t have that information but asked a colleague in the National Center for Health Statistics’ mortality statistics branch and relayed the response.
The Iowa Dept of Public Health is probably reporting based on case surveillance, not death certificates. Since we (NCHS) do the coding and assign the underlying cause, the IDPH counts are not likely based on underlying cause.
That seemed logical at the time, but not anymore.
STATE’S PUBLISHED DATA TRACK WITH “UNDERLYING CAUSE” NUMBER
A bar graph on coronavirus.iowa.gov shows fatalities recorded by the date on the death certificate. Using a spreadsheet I’ve regularly updated since the spring, I added the deaths the state website reports for every date from March 24 through November 7. Total: 1,920.
That’s four higher than the CDC’s cumulative “underlying cause” number, probably because a few deaths were attributed to the first week in November in recent days, as IDPH staff processed death certificates.
The state website showed total deaths surpassing 2,000 on November 17. But the CDC “multiple cause” numbers indicate Iowa reached that sad milestone roughly two weeks earlier.
One other fact points to the same conclusion about the state’s methodology. For months, coronavirus.iowa.gov has reported fewer deaths in Van Buren County than have area public health officials. In mid-August, Van Buren County Public Health was reporting two local deaths, while the state website listed one for that county. Local public health reported a third COVID-19 death in late August, but a month after that, the state was still reporting just one death in the county. Local officials raised the area toll to five on October 12; weeks later, the state website was showing two deaths in that county. At this writing, coronavirus.iowa.gov shows four Van Buren County deaths, while local public health has identified six.
IDPH staff have ignored many emails, beginning in August, asking why the death numbers for Van Buren County don’t match. One possibility: state personnel have determined COVID-19 was only a contributing factor in two of the Van Buren deaths, rather than the underlying cause.
I’m also keeping an eye on Appanoose County, where the state website currently reports six deaths but local public health says 25 residents have died of COVID-19. At least 20 of them passed away this month, mostly due to outbreaks at two area nursing homes. Perhaps the state numbers will catch up as death certificates reach IDPH, or perhaps the totals will remain out of sync, as in Van Buren. I’ll update this post one way or the other.
IOWA’S COVID-19 DEATHS ACCELERATING
The state’s published figures appear to exclude nearly 200 coronavirus fatalities reported to the CDC. Nevertheless, lowball numbers can’t hide Iowa’s horrific trendline, which was inevitable given the explosion in cases and hospitalizations this fall.
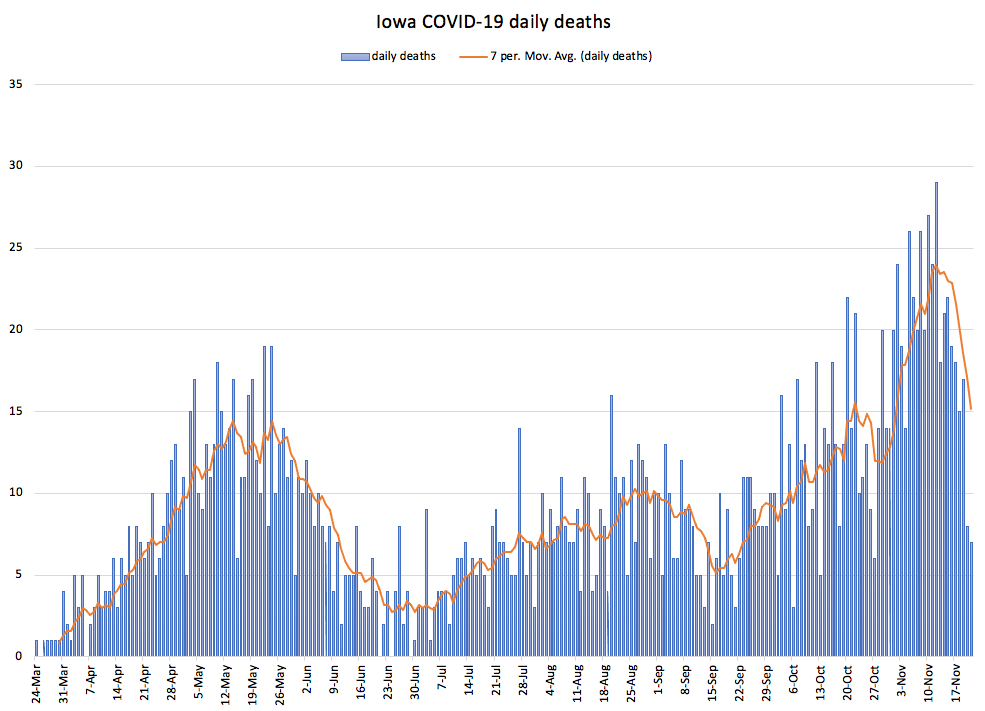
I created this graph using the numbers on the state’s dashboard for deaths at 4:00 pm on November 23. The orange line represents the seven-day moving average. The deadliest days of the pandemic in Iowa have all occurred this month: at least 29 Iowans died on November 12, 27 died on November 10, and 26 succumbed on November 5 and 8. Daily totals for most dates in the past two weeks will likely rise further as additional death certificates reach the IDPH.
COVID-19 will be Iowa’s third leading cause of death for 2020, and Iowans are now dying at the fastest pace since the pandemic began. IDPH confirmed Iowa’s first coronavirus death on March 24. Then, state data show, it took:
- 28 days to pass 100 total deaths (April 21)
- twelve days to pass 200 (May 3)
- seven days to pass 300 (May 10)
- eight days to pass 400 (May 18)
- eight days to pass 500 (May 26)
- twelve days to pass 600 (June 7)
- nineteen days to pass 700 (June 26)
- 26 days to pass 800 (July 22)
- fifteen days to pass 900 (August 6)
- twelve days to pass 1,000 (August 18)
- eleven days to pass 1,100 (August 29)
- twelve days to pass 1,200 (September 10)
- fourteen days to pass 1,300 (September 24)
- twelve days to pass 1,400 (October 6)
- eight days to pass 1,500 (October 14)
- eight days to pass 1,600 (October 22)
- seven days to pass 1,700 (October 29)
- seven days to pass 1,800 (November 5)
- six days to pass 1,900 (November 11)
- six days to pass 2,000 (November 17–though that number might have been reached after four or five days, if not for slower processing of death certificates over a weekend)
- two days to pass 2,100 (November 19)
- three days to pass 2,200 (November 22)
Again, those state numbers don’t show the whole picture. As the CDC updates its mortality tables in the coming weeks, Iowa’s “multiple cause” COVID-19 deaths through the week ending on November 21 will probably surpass 2,400.
State Medical Director Dr. Caitlin Pedati should be more transparent about her team’s methods for determining how many Iowans have died from COVID-19. Governor Kim Reynolds should insist that any fatality the CDC attributes to this virus be included in the numbers IDPH makes publicly available. Undercounting deaths obscures the pandemic’s devastating impact.
Final note: Nine newsrooms are collaborating to profile many Iowans who lost their lives this year to COVID-19. The Iowa Mourns series is well worth your time.
UPDATE: At the governor’s November 24 news conference, Ethan Stein of KCRG-TV asked why the state website shows 161 deaths for Linn County, while local officials say 181 residents have died of COVID-19. I pulled the clip:
Reynolds began by saying the state considers someone to have died of COVID-19 if their illness was confirmed by a PCR test. I’m seeking to confirm that, since no one at the IDPH has ever mentioned that criteria when I’ve asked how the state counts coronavirus deaths. The IDPH started counting antigen test positives as positive cases in late August, so it’s not clear why they would omit from statistics anyone who died after having a COVID-19 infection confirmed through an antigen test.
I don’t think antigen tests could fully explain what’s going on because even in the earliest weeks of the pandemic, there was a difference between Iowa’s reported numbers and the CDC’s “multiple cause” deaths. Antigen tests were developed in May, and the first machines were purchased for Iowa clinics in June.
Reynolds also mentioned the delay related to when state officials receive death certificates and are able to confirm information about the deceased. She added, “We’re reviewing that, and continue to review” how they report deaths in Iowa.
3 Comments
Every time I check the IDPH county covid death map...
…there are several counties that have blue colors but no numbers. That’s apart from the counties that are beige and say “no data,” which I assume means that county has had no deaths yet. (The number of beige counties has been steadily shrinking.)
If someone can explain the blue-and-blank counties, thanks in advance. I count 9(?) such counties on the map above, but it has varied over the past few months.
As an aside, if the IDPH ever undertakes any survey or study of how many Iowans are suffering serious long-term health impacts from covid, has the IDPH given Iowans sufficient reason to trust their results?
PrairieFan Mon 23 Nov 6:05 PM
County deaths
If you click on (or touch) the county, the data will appear.
Iowasmitten Tue 24 Nov 10:24 AM
Thank you!
I still don’t understand why 90 counties display data while nine counties need to be clicked on. But compared to the other mysteries of the IDPH website, especially the IDPH covid numbers, the county map mystery is a tiny one.
PrairieFan Tue 24 Nov 7:12 PM