More Iowans than ever participated in the 2020 primary, and the event changed some features of the Iowa electorate. For the first time in at least 20 years, people who choose not to affiliate with any party don’t comprise a plurality of registered voters. Democrats and Republicans both outnumber no-party voters now.
In other ways, the 529,586 Iowans who cast ballots in the June 2 election resembled past primary voters. For instance, nearly three-quarters of them were at least 50 years old, while about 13 percent were under age 35. Those proportions by age group are remarkably close to corresponding figures from the 2018 primary, when only 288,749 Iowans voted.
Follow me after the jump for a closer look at this year’s expanded voter universe by party, gender, and age.
HOW TO COUNT IOWA PRIMARY VOTERS
This post uses numbers from the statewide statistical report on the 2020 primary, a document the Iowa Secretary of State’s office published on July 14.
Unofficial numbers posted on the Secretary of State’s website last month differ somewhat from those figures. For example, the election results page indicates that 531,131 ballots were cast in Iowa’s recent primary election. But the statistical report lists “total voted” as 529,586. (The previous record turnout for an Iowa primary was 449,490 in 1994.)
Similarly, in early June the Absentee Ballot Statistics page showed that county auditors across Iowa had received 420,389 absentee ballots. However, only 411,767 Iowans voted absentee in the primary, according to the statistical report.
Staff in the Secretary of State’s office did not respond to Bleeding Heartland’s inquiry about the discrepancies. Both Linn County election systems administrator Eric Loecher and Johnson County elections worker John Deeth explained that the statistical report likely excluded ballots that were rejected for various reasons: mailed too late, unsigned or incomplete affidavit envelope, unsealed envelope, or one that had been opened and resealed. A small number of voters died after mailing their absentee ballots. (Under Iowa law, a ballot from someone who dies before election day cannot be counted.)
BOTH PARTY PRIMARIES DREW MANY INDEPENDENTS
When this year began, a plurality of registered Iowa voters were affiliated with no party. That has been the case for as long I’ve paid close attention to these numbers. The Secretary of State’s website has monthly registration totals going back to 2000. I couldn’t find any month before June 2020 when no-party voters didn’t outnumber registered Democrats and Republicans.
In contrast, as of July 1, Democrats and Republicans each make up about 34 percent of the active registered voters, while about 31 percent are no-party voters and a little more than one-half of one percent are “other,” mostly Libertarians. “Active” registered voters have cast a ballot in at least one election during the past four years.
Two events prompted tens of thousands of independents to affiliate with a party this year: the Iowa caucuses and the primary election. Democrats gained more participants for the caucuses, due to the competitive race for the presidential nomination, which allowed Democrats to overtake the GOP in statewide registrations by March.
Republicans attracted more new registrants before the primary, thanks to competitive races for the nomination in all four Congressional districts. (Although Democrats did have a four-way statewide U.S. Senate primary, the party’s races for the four U.S. House seats were uncontested.) The number of Republicans increased most in the closely watched fourth district, where State Senator Randy Feenstra defeated longtime incumbent Steve King. The five-way primary in the second district helped the GOP slightly reduce the Democratic edge there. In the first and third districts, both parties gained roughly the same number of registrants from March to July.
This table shows party registration figures statewide and in each of the Congressional districts as published by the Secretary of State’s office at the start of the year, on March 2 (reflecting Iowans who changed their registration in order to participate in the caucuses), and on July 1 (reflecting those who chose a party in order to vote in the primary).
In all three Democratic-held U.S. House seats, the Democratic voter registration advantage was larger going into the general election campaign than it had been when 2020 began. Conversely, Republicans have a larger lead in registrations in IA-04 now than they did in January.
| Changing Iowa registration totals | |||
| Party registration | January 2020 | March 2020 | July 2020 |
|---|---|---|---|
| IA-01 | |||
| Democrats | 160,786 | 166,752 | 179,951 |
| Republicans | 139,075 | 136,647 | 150,611 |
| no-party voters | 196,683 | 188,817 | 164,279 |
| IA-02 | |||
| Democrats | 164,565 | 173,089 | 180,015 |
| Republicans | 142,659 | 140,552 | 151,808 |
| no-party voters | 190,426 | 182,487 | 159,087 |
| IA-03 | |||
| Democrats | 171,364 | 180,458 | 192,631 |
| Republicans | 169,485 | 165,291 | 177,452 |
| no-party voters | 180,864 | 170,769 | 152,607 |
| IA-04 | |||
| Democrats | 117,801 | 122,600 | 128,551 |
| Republicans | 188,749 | 185,664 | 201,918 |
| no-party voters | 178,521 | 171,618 | 151,471 |
| statewide | |||
| Democrats | 614,519 | 642,899 | 681,148 |
| Republicans | 639,969 | 628,154 | 681,789 |
| no-party voters | 746,492 | 713,692 | 627,444 |
MORE DEMOCRATS VOTED OVERALL, AND FAR MORE VOTED EARLY
Paradoxically, although the primary helped Republicans catch up to Democrats in statewide registrants, Democrats had a higher turnout rate. The statistical report shows that 281,544 Iowans voted in the Democratic primary, which was 38.5 percent of the 730,880 registered Democrats (that includes all registered voters, not just the “active” ones). About 34.3 percent of Iowa Republicans (246,816 out of 719,795) cast a ballot in the June primary.
The overall turnout of 529,586 represented 24.5 percent of Iowa’s 2,166,155 registered voters.
Due to the coronavirus pandemic, an unusually large number of 2020 primary voters used the mail. Secretary of State Paul Pate helped by extending the early voting window from 29 days to 40 days and by sending an absentee ballot request form to every active registered voter. About 82.8 percent of Democrats who participated (233,255 out of 281,544) cast an early ballot. A majority of Republicans voted early as well, but the percentage was smaller: 72.0 percent (177,749 out of 246,816).
That’s consistent with the trend from the last several general elections in Iowa: Democrats are more likely to vote early than Republicans. It’s been true for midterm elections as well as presidential years.
If you’re wondering why Republican legislators rushed last month to approve new barriers to processing absentee ballot request forms, there’s your answer.
The GOP also enacted a law requiring the secretary of state to seek legislative approval for all election-related procedural changes. Proponents of that language intended to stop Pate from mailing absentee ballot request forms to all Iowa voters before the general election. Republican lawmakers relented after it became clear their stance could put their party at a disadvantage, since county auditors in large Democratic-leaning counties were going to send their own mailing to all constituents.
Iowa’s absentee ballot statistics don’t distinguish between those who vote by mail and those who vote early in person at a county auditor’s office or satellite polling location. There was less early voting in person this year due to social distancing concerns. I expect the same for November, especially if COVID-19 infections surge this fall along with other seasonal viruses.
WOMEN TURNED OUT AT HIGHER RATE, WERE MORE LIKELY TO VOTE EARLY
Iowa women had a slightly higher turnout rate for the last presidential election as well as the 2018 primary and general elections, and the trend held this year.
The 292,598 women who voted in last month’s primary represented 25.9 percent of all Iowa women registered to vote. About 22.8 percent of the registered male voters (236,988) cast a ballot.
As has been the case for the past decade, Iowa women have taken to early voting more than their male counterparts. About 79.3 percent of women who participated did so with an absentee ballot, while 75.8 percent of men voted early.
The statewide statistical report breaks the numbers down by gender within each party, so we can see that 83.3 of women voters in the Democratic primary cast an early ballot, while 82.2 percent of Democratic men did so. On the Republican side, the disparity was greater: 74.0 percent of Republican women voters used an absentee ballot, while 70.0 percent of men who voted in the GOP primary did so.
I haven’t seen any solid research on why women have gravitated more toward early voting. My hypothesis is that as a group, women have more caregiver obligations, so tend to worry more about an unexpected family illness or emergency preventing them from getting to the polls on election day.
OLDER VOTERS CONTINUE TO DOMINATE PRIMARY ELECTORATE
Iowans of all ages participated in the 2020 primary at higher rates than in past primaries. But as Bleeding Heartland has observed before, this state’s electorate skews old, and that’s especially true for primary voters.
This table shows the age distribution for all Iowans who voted in this year’s Democratic or Republican primaries. Note: Under a new law, 17-year-olds can vote in an Iowa primary, provided they will turn 18 by the date of that year’s general election. Statewide, 574 eligible people took advantage of the opportunity.
| Turnout by age group, Iowa 2020 primary election | |||||||
| Age | 17 | 18-24 | 25-34 | 35-49 | 50-64 | 65 and over | total |
|---|---|---|---|---|---|---|---|
| Registered | 4,065 | 233,003 | 375,446 | 491,521 | 532,066 | 530,054 | 2,166,155 |
| Total voted | 574 | 23,284 | 39,553 | 76,679 | 147,142 | 242,354 | 529,586 |
| Turnout rate | 14.1% | 10.0% | 15.6% | 27.7% | 26.1% | 45.7% | 24.5% |
| Percent of ballots cast | 1.1% | 4.4% | 7.5% | 14.5% | 27.8% | 45.8% | 100% |
Nearly three in four Iowans who voted in the primary (73.6 percent) were at least 50 years old. Just 13 percent were under age 35.
That in a nutshell is why many Democrats are relieved that Joe Biden is the presidential nominee, rather than Bernie Sanders.
Let’s look at the same data for Democratic primary voters only.
| Turnout by age group, Iowa 2020 Democratic primary | |||||||
| Age | 17 | 18-24 | 25-34 | 35-49 | 50-64 | 65 and over | total |
|---|---|---|---|---|---|---|---|
| Registered | 1,753 | 68,503 | 114,746 | 149,704 | 178,035 | 218,139 | 730,880 |
| Total voted | 412 | 14,388 | 25,279 | 42,149 | 72,751 | 126,565 | 281,544 |
| Turnout rate | 23.5% | 21.0% | 22.0% | 28.2% | 40.9% | 58.0% | 38.5% |
| Percent of ballots cast | 1.5% | 5.1% | 9.0% | 15.0% | 25.8% | 45.0% | 100% |
Across the board, Democratic turnout was up substantially.
Even so, seven in ten Iowa Democratic primary voters this year were at least 50 years old, while only about one in six were under age 35. That’s similar to the proportions from the 2018 primary.
| Turnout by age group, Iowa 2018 Democratic primary | ||||||
| Age | 18-24 | 25-34 | 35-49 | 50-64 | 65 and over | total |
|---|---|---|---|---|---|---|
| Registered | 55,555 | 103,244 | 136,612 | 175,427 | 194,494 | 665,332 |
| Total voted | 7,914 | 17,770 | 28,341 | 50,134 | 76,682 | 180,841 |
| Turnout rate | 14.3% | 17.2% | 20.8% | 28.6% | 39.4% | 27.2% |
| Percent of ballots cast | 4.4% | 9.8% | 15.7% | 27.7% | 42.4% | 100% |
As a group, general election voters in Iowa skew less old than do those who take part in primaries. Nevertheless, voters over 50 will likely cast more than half of the ballots in the November election, even if GOTV efforts among younger Iowans are successful.
I don’t mean to discount the importance of outreach to every age cohort. If the race between Biden and Donald Trump remains close here, higher turnout among young voters could be decisive.
But for the foreseeable future, Democrats won’t be able to win statewide in Iowa unless the party’s candidates have broad appeal among older voters.
Looking ahead to the next cycle, when Democrats are likely to have spirited contests for governor and U.S. Senate: the age breakdown of this year’s primary electorate suggests that a candidate who appeals mainly to a younger demographic will not be well-positioned to win the nomination for any statewide office in 2022.
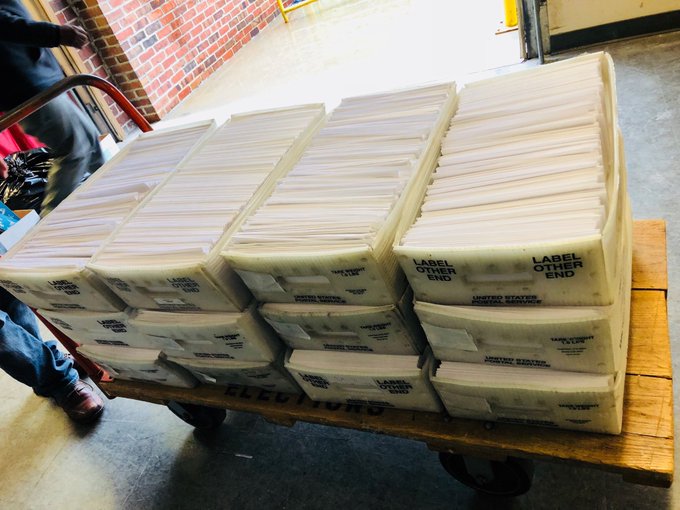
Top photo: Twelve boxes of absentee ballots ready to be mailed to Polk County voters in May 2020. Posted on the Facebook page of Polk County Auditor Jamie Fitzgerald.